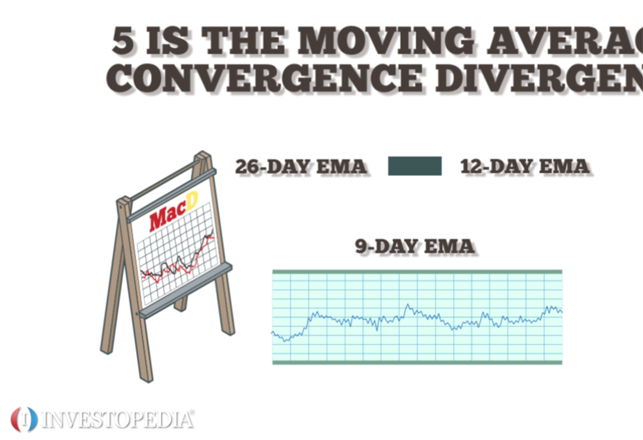
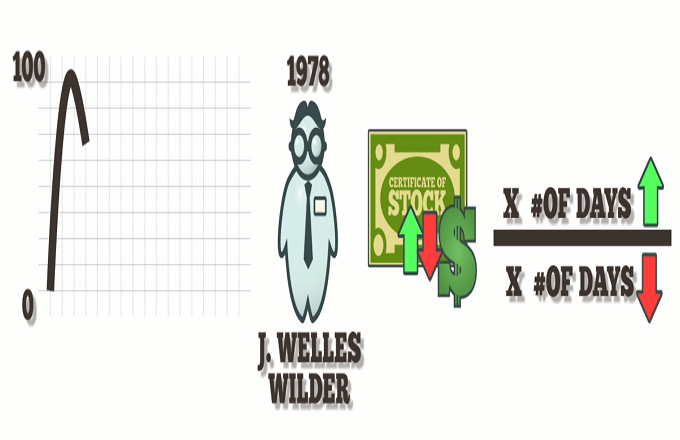
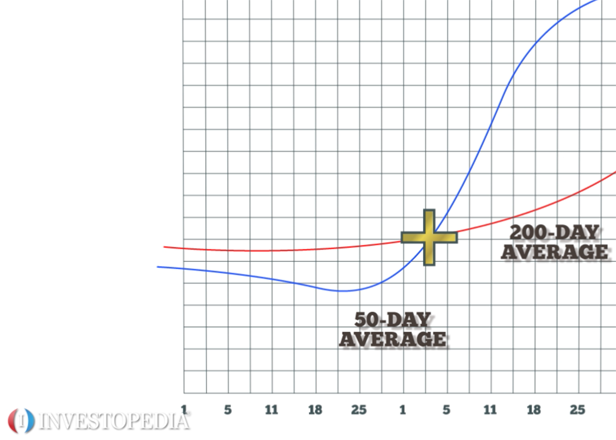
The stochastic oscillator and the moving average convergence divergence (MACD) are two indicators that work well together.The stochastic oscillator compares a stock’s closing price to its price range over a period of time. Its K line indicates the number of time periods, and its D line is the moving average of the K line. When the K line drops below 20, the stock is oversold, and it indicates a buying signal. If the K peaks just below 100 then retreats, the stock should be sold before the value drops below 80. And generally, when the K value rises above the D, it’s a buy signal as long as the values are below 80. If they are higher than 80, the security is overbought. The MACD indicates price trends and direction. Subtract a security’s 26-day exponential moving average from its 12-day moving average to create an oscillating indicator value. The trigger line is the nine-day EMA. If the MACD value is higher than the nine-day EMA, it’s a bullish moving average crossover. A bullish signal occurs when a faster moving average crosses above a slower moving average, creating market momentum and signaling more price increases. When using the stochastic oscillator and MACD together, look for bullish crossovers that occur within two days of each other. The MACD should cross slightly after the stochastic. Otherwise, a false price trend indication may appear.


