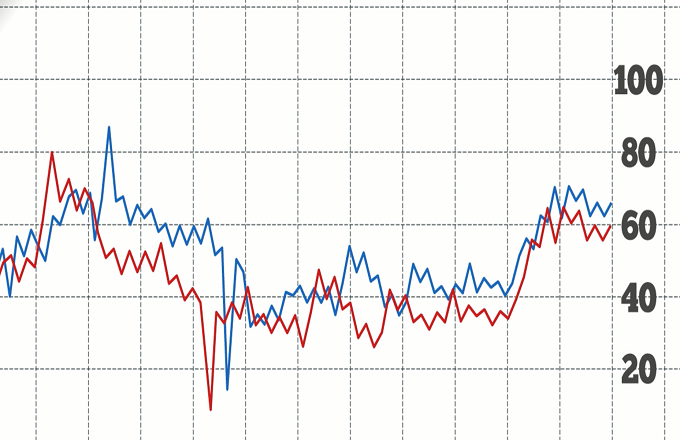
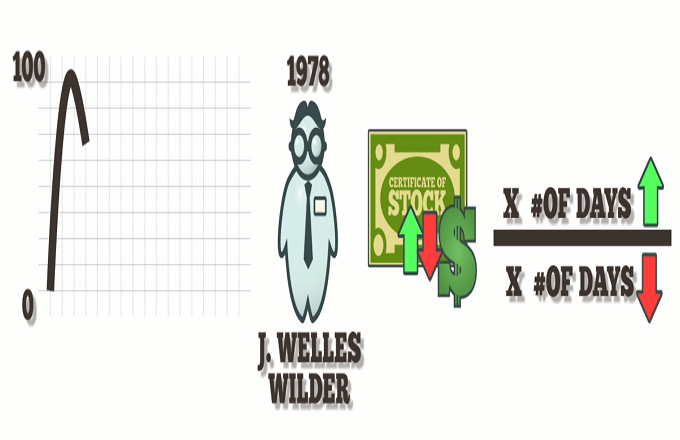
Technical indicators determine the direction of an asset’s momentum and whether that direction will continue. Here are seven used most.Number 1 is the on-balance volume indicator, which keeps a running volume total by adding or subtracting to each period’s volume depending on the price’s movement. If the price goes up one day, that day’s volume is added to the period’s volume; if it does down, the day’s volume is subtracted. A rising OBV line indicates prices should rise as demand emerges. 2 is the accumulation/distribution line, which measures a security’s money flow. It will show if investors are accumulating, or buying, a certain security, or distributing it. If the line is trending up, it’s a signal of increasing buying pressure, and downward means more selling pressure. 3 is the average directional index. It measures the strength and momentum of an existing price trend. An ADX figure above 40 shows a trend that’s considered to be strong, either up or down. Below 20 is a weak trend. 4 is the Aroon indicator, which measures if a security is in a trend, and the strength of that trend. Aroon values indicate how recent the latest highs and lows were. Higher values mean there have been more recent highs and lows, and lower values mean less recent highs and lows. A bullish and a bearish Aroon is calculated and plotted on a chart. A security is trending up when its up line is trending above 70 and above the down line. It’s trending down when the down line is above 70 and also above the up line. 5 is the moving average convergence divergence. It subtracts the 12-day exponential moving average from the 26-day EMA and plots the line on a chart over a nine-day EMA, which serves as the signal line. When the MAC-D crosses the signal line, it reveals entry and exit points. 6 is the relative strength index, which shows when securities are overbought or oversold. The RSI is plotted between zero, the highest oversold condition, and 100, the highest overbought condition. An asset is overbought when it nears the 70 level, making it likely to pull back. And 7 is the stochastic oscillator, which compares a security’s closing price to its price range over a given time period. In an upward trend, prices close near their highs; in a downward trend, they close near their lows.