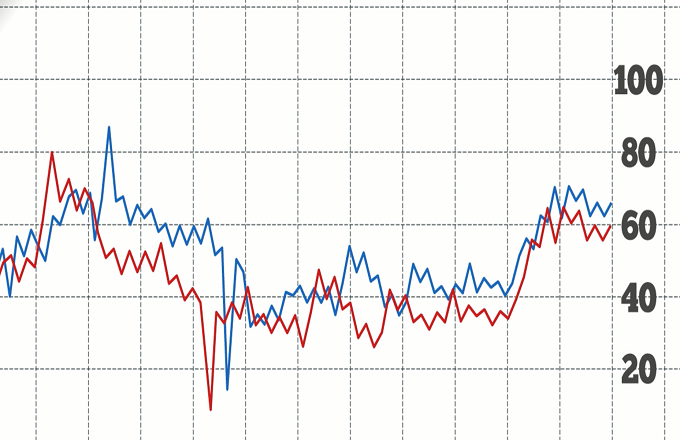
A golden cross forms on a graph when a security’s short-term moving average crosses its long-term moving average.Moving averages, which measure a stock’s average closing price over a period of days, are studied by technical traders who analyze trends in stock prices. You would see a golden cross on a graph when a stock’s 50-day short-term moving average crosses above its 200-day moving average. Many technicians see a golden cross as a sign that a stock’s value is headed higher. If a stock’s performance continues to lag, and no golden cross appears, its moving averages will remain roughly parallel to one another. A golden cross can also be a promising sign for an economy, as it may precede a bull market. Keep in mind that investors can choose arbitrary time frames to make a golden cross appear. A golden cross won’t reveal whether or not investors intend to sell their shares.