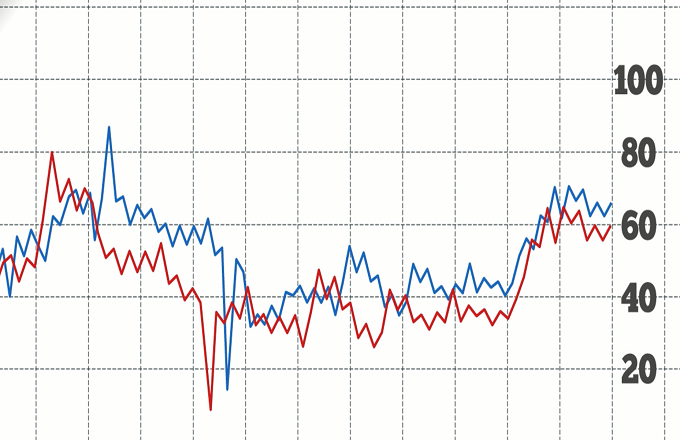
The Relative Strength Index, developed by technical analyst J. Welles Wilder in 1978, is a technical indicator that measures the velocity and magnitude of changes in a stock’s price.The RSI graphically represents price momentum data by oscillating between zero and 100. It’s an average of an asset’s gains and losses over a specified period. Its formula requires dividing the average of X number of days with an up close, by an average of X number of days with a down close. The RSI identifies stocks that are potentially overbought or oversold. Price movements above 70 mean the stock is considered overbought. When the price moves below 70, it’s a bearish indicator. Price movements below 30 mean the stock is oversold. When it moves above the 30 level, it’s a bullish indicator. At 50, the price’s momentum is neutral. A divergence between an asset’s price movement and the RSI oscillator can signal a potential reversal. For example, a bearish divergence forms when the stock reaches a higher high and the RSI reaches a lower high. A failure swing also indicates a reversal. For example, a bearish failure swing begins to form when the RSI tops 70. It then moves below 70 before reversing upward again, but this time remaining below 70. Then the RSI falls again below the prior low, generating a bearish signal. The RSI is most reliable in a ranging market and can give misleading signals in a trending market. It should be used to complement other indicators as part of a broader trading strategy.