


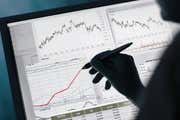
Technical traders use the price history of any asset, and the price patterns that form, as a basis for making trading decision and analysis. This is called technical analysis, a technique that uses the price chart of an asset as a key determinant in forecasting where the price will go next.
Price charts are highly visual, showing where a stock price has been in the past, the price's current trajectory, how volatile the price movements are, and whether the stock has a lot or little interest in it.
[ Investopedia Academy offers an in-depth video course that teaches identification of chart patterns. Watch the trailer now for the Technical Analysis course. ]
What Can You Learn from Charts?
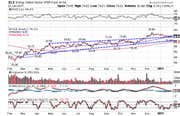
Chart patterns are a field of study within the larger field technical analysis. Chart patterns are geometric shapes created by the price movements of an asset, such as a stock, currency, or commodity. These geometric shapes provide a context for how the asset is moving right now, and the direction and magnitude of the price moves that may be forthcoming.
Chart patterns are a key tool in the technical trader's arsenal. This tutorial covers the main types of charts patterns, including how to trade them and what insights they provide into current and future price movements.
Analyzing Chart Patterns: Why Charts?
-
 Trading
Long-Term Traders Are Bullish on Commodities
Bullish chart patterns on key commodity-related ETFs suggest that the remainder of 2017 could be the best time to buy. -
 Investing
How To Spot And Screen For Chart Patterns With Finviz
Learn how to use Finviz software for finding chart patterns. -
 Trading
Continuation Patterns: An Introduction
Learn the most common varieties of continuation patterns and how they work in market analysis. -
 Trading
Active Traders Shift Their Attention to Energy
Bullish chart patterns within the energy sector suggest that now could be the time to buy. -
 Trading
3 Charts That Suggest the Uptrend in Financials Should Continue
Positive chart patterns suggest that there could be more room to run for financial stocks.