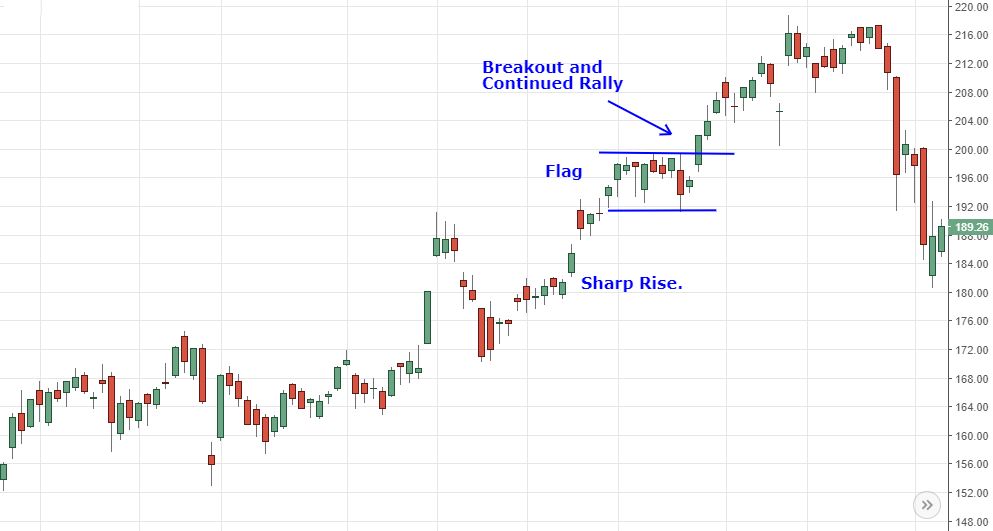
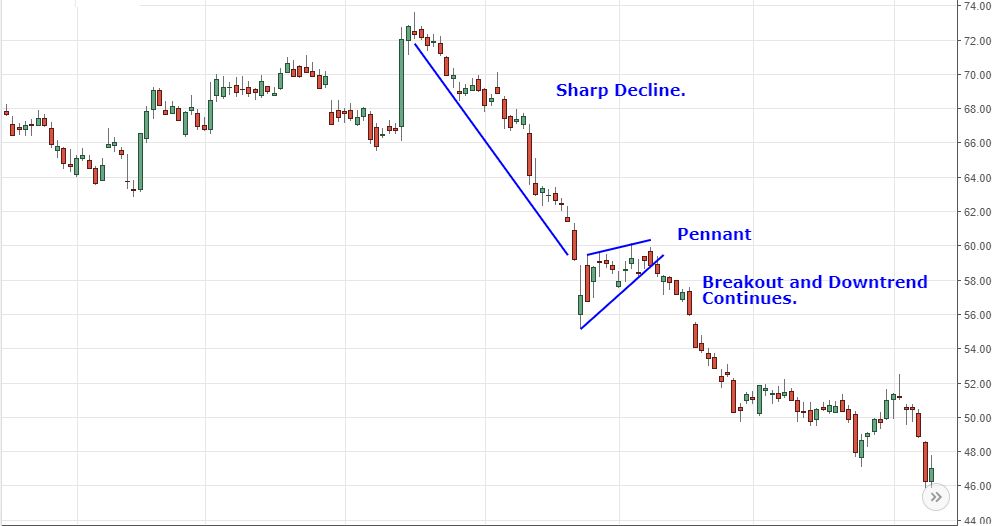
Flags and pennants are continuation patterns. They are traded in the same way, but each has a slightly different shape. The terms flag and pennant are often used interchangeably.
A flag or pennant pattern forms when the price rallies sharply, then moves sideways or slightly to the downside. This sideways movement typically takes the form or a rectangle (flag) or a small triangle (pennant), hence their names. Draw trendlines along the highs and lows of the sideways price action. The sharp price rise preceding the flag or pennant is called the flag pole.
The sideways period is often followed by another sharp rise. This is where the trading opportunity comes in. Once the flag pole and a flag or pennant have formed, traders watch for the price to breakout above the upper flag/pennant trendline. When this occurs, enter a long trade.

The above pattern is bullish, because the pattern started with a sharp rally. There are also bearish patterns, where the price drops sharply then forms the flag or pennant. With this pattern, watch for the price to break below the flag/pennant.

If a short trade is taken on the downside breakout, place a stop loss above the high of the flag/pennant (not the flag pole).
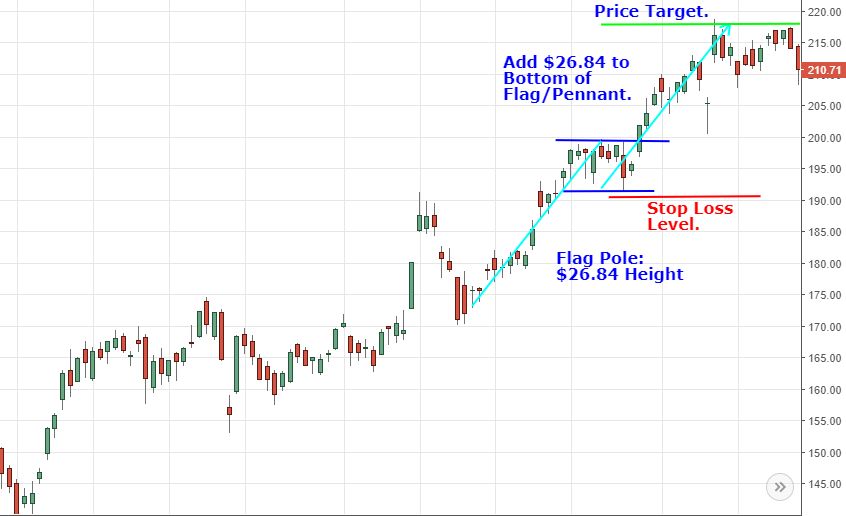
If a long trade is initiated on an upside breakout, place a stop loss below the low of the flag or pennant (not the flag pole).
Price Target
The concept behind the flag and pennant patterns is that the momentum seen during the flag pole phase could continue once the pattern completes. Therefore, measure the size of the flag pole, then add that length to the bottom of the flag/pennant for bullish patterns.

For bearish patterns, subtract the length of the flag pole from the top of the flag/pennant.

Trading Considerations
Flags and pennants occur in both uptrends and downtrends. Focus on trading upside breakouts from bullish patterns during uptrends. While a downside breakout may indicate the price could move lower for a time, going short during an uptrend is a less reliable trade.
Similarly, if an asset is trending lower, focus on trading downside breakouts from bearish patterns.
Since flag poles can be quite large, and the size of the flag/pennant quite small, these types of patterns produce favorable risk/reward ratios. The reward or profit target is based on the strong movement of the flag pole. The stop loss, on the other hand, is based on the small area that forms the flag/pennant. Reward potential on these trades often outweighs risk by a factor of three, or more.
Analyzing Chart Patterns: The Wedge
-
 Trading
Technical Analysis: Triple Tops and Bottoms
Triple and double tops and bottoms may be tough to spot but can be powerful patterns. -
 Trading
Citigroup Stock Is Ready to Break Out Again
Share of Citigroup have a solid floor and should continue to strengthen. -
 Trading
3 Charts That Commodity Traders Will Want to Watch
Despite recent periods of consolidation on the charts of most commodities, active traders will maintain a bullish bias due to nearby support levels. -
 Trading
EUR/USD Retreats After Hitting Monthly High
EUR/USD Fell under pressure in the first half of European trading on Tuesday after briefly trading at levels not seen since mid-February. -
 Trading
Watch for Breakouts in These Commodity ETFs
Major commodities such as oil, gold, and silver are all consolidating in tight patterns following a rally and are poised to breakout. -
 Trading
3 Transport Stocks That Are Ready to Fly Higher
Transportation stocks are about to take off, and that could give the whole market a lift.


