


Double tops and bottoms are reversal patterns. A double top signals the price is no longer rallying, and that lower prices are potentially forthcoming. A double bottom indicates the price is no longer falling, and the price is heading higher.
Double Tops
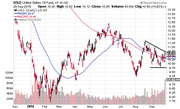
A double top forms when the price makes a high within an uptrend, and then pulls back. On the next rally the price peaks near the prior high, and then falls below the pullback low. It's called a double top because the price peaked in the same area twice, unable to move above that resistance area.
The pattern is complete—traders may take short positions or exit long positions—when the price drops below the pullback low. For example, if the price hits a high of $50, pulls back to $47, rallies to $50.05, and then drops back below $47, the pattern is complete and that could indicate that the price will continue to drop.

For trading purposes, short positions may be initiated when the pattern completes. It's also advisable to avoid longs, since the price could decline further. A stop loss on short positions is placed above the latest peak, or above a recent swing high within the pattern.
Price Target
The estimated decline is equal to the height of the pattern subtracted from the breakout point. If the pattern high is $50.05 and the pullback low is $47, when the price breaks below $47, subtract $3.05 from $47 to get a target of $43.95.

The rationale for the double top pattern is that uptrends make higher swing highs and higher swing lows. Once the pattern completes the price failed to make a substantially higher swing high, and then proceeded to make a new low by dropping below the prior pullback low. This draws the uptrend into question, and there is evidence of a downtrend beginning.
Double Bottoms
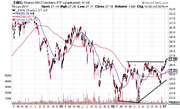
A double bottom forms when the price makes a low within a downtrend, and then pulls back to the upside. On the next decline the price stalls near the prior low, then rallies above the pullback high. It's called a double bottom because the price stalled in the same area twice, unable to drop below that support area.
The pattern is complete, and traders may take long positions, when the price rallies back above the pullback high. For example, if the price drops to $47, pulls back to $50, drops to $46.75, then a rally back above $50 signals that the price will continue to head higher.

Price Target
Patterns may cover a large price or time area, or they may be small, occurring quickly. The price target adjusts to the size of the pattern. Smaller patterns have smaller price targets than big patterns. The price target for the double bottom is similar to the double top, except with the double bottom we add the height of the pattern of the breakout point. If the height of the pattern is $3, add $3 to the breakout point.

Trading Considerations
Not all traders are interested in taking positions on a chart pattern breakout. Even so, the double top (bottom) pattern still alerts traders when they may wish to reconsider their long (short) positions.
The price target is only an approximation of how far the price could move after a breakout. The price may not reach the target level, which is why a stop loss is used, or the price could fall well below the target.
What the target does provide is a reward:risk ratio, and that is one of the shortcomings of this pattern. The price target and stop loss are based on the height of the pattern. This means the expected profit and risk are roughly the same. Typically, professional traders prefer trades where the profit potential is great than the risk. The reward:risk is improved if the stop loss is placed below the high of a topping pattern or above the low of a bottoming pattern, although this will still typically only result in a reward:risk of 1:1 to 2:1.
Not all patterns are worth trading. The ones offering higher reward:risk are preferred. Even if a pattern isn't traded, it still provides valuable insight into the short-term direction of the price.
Analyzing Chart Patterns: Triangles
-
 Trading
Time to Sell These Stocks Wiith Double Tops
These stocks have completed a topping pattern, indicating their run higher may be over. -
 Investing
These ETFs are Breaking Out of Chart Patterns Now
Three buys and one sell; here are four ETFs breaking out of chart patterns right now. -
 Trading
Technical Analysis: Triple Tops and Bottoms
Triple and double tops and bottoms may be tough to spot but can be powerful patterns. -
 Trading
Inverse Head and Shoulders Patterns Breaking Out
Watch for higher prices if these stocks complete inverse head and shoulders patterns (a bottoming pattern). -
 Trading
Watch for Breakouts in These Commodity ETFs
Major commodities such as oil, gold, and silver are all consolidating in tight patterns following a rally and are poised to breakout. -
 Trading
Global Market ETFs at Breakout Levels
These global market ETFs are breaking through resistance at 52-highs.