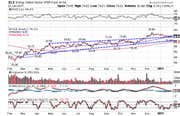
The size of a chart pattern, and where it occurs within a trend, provides clues as to how big the next price move will be once the chart pattern completes. When the price finally breaks out of the chart pattern (completion) this indicates the direction the price is likely to continue moving. Therefore, chart patterns are useful tools for any trader, whether they trade the patterns or use them for analytical purposes.
Reversal Patterns Vs. Continuation Patterns
There are two main types of charts patterns: reversal patterns and continuation patterns. Reversal pattern signal an end to the trend that was in place prior to the chart pattern forming. For example, if the price had been trending higher and then a reversal pattern forms and completes, the uptrend is likely over. Continuation patterns signal the continuation of a trend. If the price is moving lower, then a continuation pattern forms and the price breaks out (completes) in the trending direction, then that downtrend is likely to continue.

Traders highlight chart patterns by using trendlines. Trendlines are drawn along high and low points on the chart. These trendlines are then used to signal when the price is breakout of, or completing, the pattern.
There is subjectivity involved in drawing trendlines, which means chart patterns are not an exact science. One person may see a pattern someone else does not, or draw their trendlines in a different way leading to a different pattern or breakout point. Such differences affect the performance of trades based on the patterns. Even though there is subjectivity, new traders should not be discouraged if they don't immediately find trading chart patterns profitable. With practice and experience traders will develop skills which aid them in assessing which chart patterns to trade, and how, and which patterns to leave alone.
There are a number of chart patterns to be aware. Each provides its own insight into where the price could go in the future, and how far. Certain patterns can be used as a trading strategy, with an entry point, a stop loss level which helps control risk, and a target price for locking in gains. Traders may alter these techniques, based on their own experience or market observations.
Analyzing Chart Patterns: Head And Shoulders
-
 Trading
Analyzing Chart Patterns
Learn how to evaluate a stock with a few easy-to-identify chart patterns. -
 Trading
Continuation Patterns: An Introduction
Learn the most common varieties of continuation patterns and how they work in market analysis. -
 Trading
Inverse Head and Shoulders Patterns Breaking Out
Watch for higher prices if these stocks complete inverse head and shoulders patterns (a bottoming pattern). -
 Trading
3 Charts That Commodity Traders Will Want to Watch
Despite recent periods of consolidation on the charts of most commodities, active traders will maintain a bullish bias due to nearby support levels. -
 Trading
Long-Term Traders Are Bullish on Commodities
Bullish chart patterns on key commodity-related ETFs suggest that the remainder of 2017 could be the best time to buy. -
 Trading
Active Traders Shift Their Attention to Energy
Bullish chart patterns within the energy sector suggest that now could be the time to buy. -
 Trading
Hudson Pacific Properties Stock Set to Break Out
An ascending triangle chart pattern suggests upside potential for shares of the real estate investment trust.


