


The triangle can be a continuation or a reversal pattern. Although, more often it is a continuation pattern. There are three types of triangles: symmetric, ascending, and descending. For trading purposes they are all the same, the just look different.
A triangle forms when the price action narrows over several price swings. If trendlines are drawn along the highs and lows of the price action, the trendlines converge towards each other. This creates the appearance of the triangle.
How to Use Triangles
Triangles occur in uptrends and downtrends. Since they can be continuation or reversal patterns, traders wait for the price to break out of the pattern to indicate which direction it is going.
Since continuation triangles occur more often than reversal triangles, focus more on breakouts to the upside during uptrends and breakouts to the downside during downtrends.
To draw a triangle there needs to be at least two swing highs and two swing lows. Trendlines are drawn along the highs and lows, respectively, and extend out to the right. The price may make a couple more swings within the triangle. Re-draw the trendline, if needed, to accommodate these new price swings.
When the price moves above the upper trendline it signals the price is likely to move higher. The pattern is complete. If the price drops below the lower trendline it signals the price is likely to continuing dropping.
Symmetric triangles are created when both trendlines are moving towards each other.

An ascending triangle occurs when the lower trendline is rising while the upper trendline is horizontal. This shows that swing lows are rising but the rallies are stopping near the same resistance level.

A descending triangle is when the upper trendline is sloped downward, while the bottom trendline is horizontal.

With all three types of triangles, take a trade when the price breaks out of the pattern. The exact breakout price is subjective, as tiny alterations in how the trendline is drawn will alter the breakout price level.
Place a stop loss just outside the pattern, on the opposite side from the breakout. For example, if buying an upside breakout, place a stop loss just below the lower trendline. If going short on a downside breakout, place a stop loss just above the upper triangle trendline.
Price Target
The height of a triangle at its base, or widest part, provides some clues as to how far the price could run following the breakout. To get this estimate, add the height of the pattern to the breakout point in the event of an upside breakout. Subtract the height of the triangle from the breakout point for a downside breakout.
Use the swing low and swing high at the base of the pattern to make this estimate, instead of measuring the distance between trendlines.

Trading Considerations
Since continuations are more reliable than reversals, if an upside breakout occurs during an uptrend consider taking a long position. If the price breaks to the downside during an uptrend, think twice before shorting it. That said, don't let biases or beliefs interfere with what the market is actually doing. Even though an upside triangle breakout may be more likely during an uptrend, a downside breakout sends a warning signal that the uptrend could be in trouble, or that price will move lower for a while.
The reward:risk ratio on triangles is always better than 1:1, which is favorable. This is because the profit target is based on the entire height of the pattern, whereas the stop loss is based on the smaller portion of the triangle once the trendlines have converged. Favor trades where the potential reward outweighs the risk by a factor of two or more.
Analyzing Chart Patterns: Flags And Pennants
-
 Trading
Four Triangle Patterns to Keep An Eye On
These four stocks are consolidating in triangle patterns following big moves. A breakout could kick start another significant price trend. -
 Trading
Stocks Nearing Triangle Breakout Levels (TIVO)
Triangles breakouts can provide a risk-controlled way to participate in the next wave of a stock's trend. -
 Investing
Stocks with Breakout Potential (MDT, SLM)
Stocks are moving within narrowing price bands and are poised for a breakout. -
 Trading
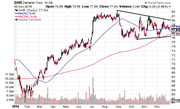
Watch for a New Year Breakout in These Stocks (DHR, FIS)
The narrowing price patterns in these stocks can't last for long. Watch for a breakout. -
 Trading
Waiting on a Breakout in Banking and Financial ETFs
These financial ETFs are stuck in a triangle pattern after a strong rally. Watch for the breakout, in either direction. (KBE,IYG) -
 Trading
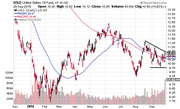
Watch for Breakouts in These Commodity ETFs
Major commodities such as oil, gold, and silver are all consolidating in tight patterns following a rally and are poised to breakout. -
 Investing
These Stocks Are Sqeezed and Ready Pop (PE, ALK)
With the price action being compressed in these stocks for some time now, the chance of a breakout is increasing. -
 Trading
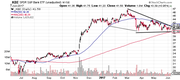
Brazil Small Caps Set to Rally 30%
The iShares ETF tracking Brazilian small caps has formed an ascending triangle pattern, suggesting the potential for a 30% rally.