A gap is empty space between one price bar and the next. Gaps occur when the price significantly changes from the close of one price bar to the next, with no trading taking place in the empty space between the bars.
Gaps occur unexpectedly, which is why no trading occurs between the two price bars. From one day to the next the perceived value of the asset amongst investors has changed. Because they are unexpected, gaps can be used for analytical insight, as different types of gaps indicate whether a trend is starting, accelerating, or near its end.
There are four types of gaps: common, breakaway, runaway, and exhaustion, as well as a gap pattern called an island reversal.
Common Gaps
Common gaps provide no significant analytical insight, and are regular occurrences. Common gaps are small, meaning the price difference between the two gapping bars is not significant. Common gaps occur frequently in stocks from one day to the next, and in currency markets over the weekend.
Common gaps are typically, but not always, "filled." For example, if a stock closes at $50 on Monday, and then opens at $50.25 on Tuesday, the price will often move back to $50 within the next few days. If the price goes back to where the gap started, technicians consider the empty space filled.
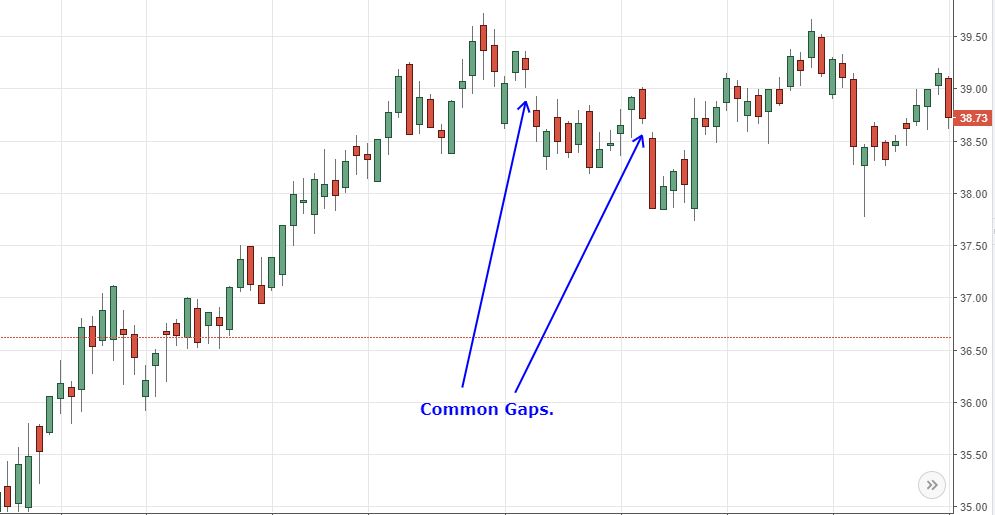
Since the gaps occur regularly, they don't tell much about the future direction of the price.
Breakaway Gaps
Assets prices move in ranges or trends. Ranges are when then the price is moving up and down, but little progress is made in either direction. Trends occur when the price is making progress either up or down over multiple price swings. When a price moves from ranging to trending, it will sometimes start that trend with a breakaway gap.
A breakaway gap shows decisive movement out of a range or other chart pattern. These types of gaps are commonly associated with heavy volume, showing the strong conviction of the breakaway. These types of gaps are most commonly associated with major news events, or earnings announcements in individual stocks, which rapidly change investor sentiment.
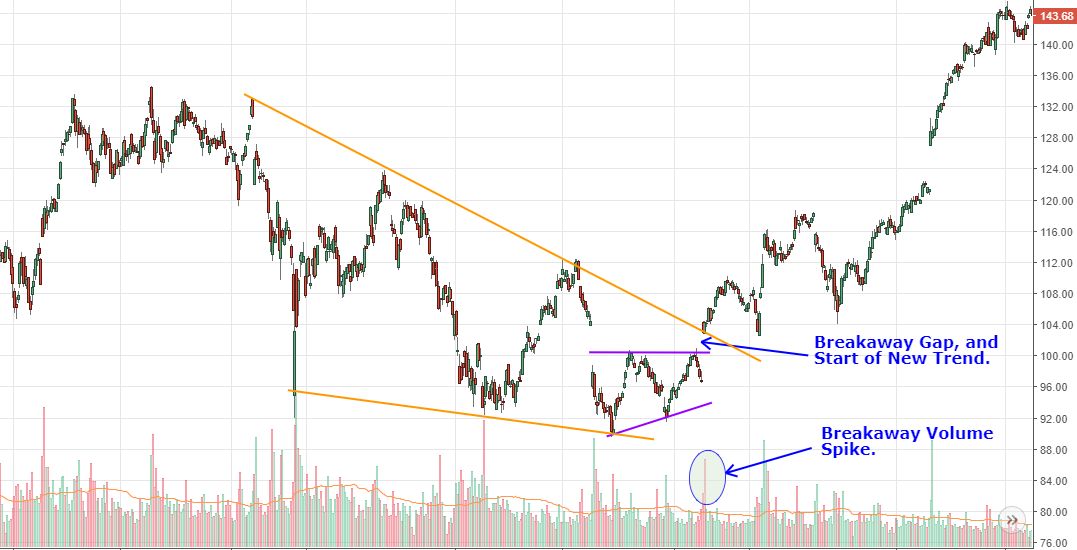
Breakaway gaps don't tend to fill, or at least not for a long time. Instead, the price tends to run in the same direction as the breakway for some time after. The times when breakaway gaps do fill, the breakout direction usually prevails. The price may move back to where the gap started, fooling traders into thinking the gap was a false breakout, but then the price usually keeps moving in the breakaway direction.
Breakways gaps can occur to the upside or downside. The analytical insight is the same: expect further movement in that breakaway direction.
Runaway Gaps
Once a trend starts and has been underway for a while, more traders start hearing about it. Any positive news or catalyst brings in traders who have been waiting to get in. This causes a runaway gap, or a gap within the middle of the trend, indicating that the trend is still strong and picking up steam.
These types of gaps are also typically associated with a volume increase, but lots of volume isn't as important here as it is with breakaway gaps.
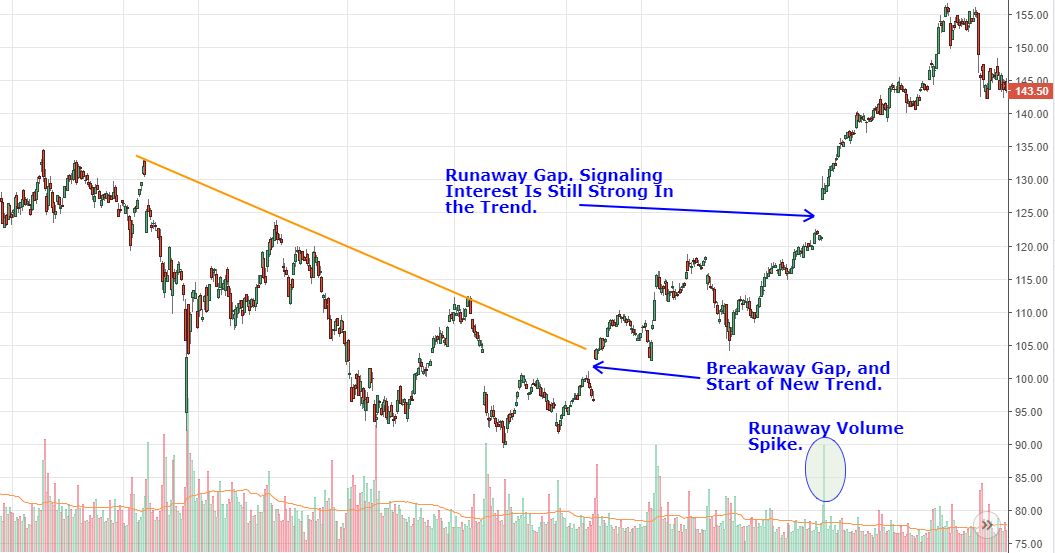
Runaway gaps signal a continuation of the trend. Traders already in positions will view the event as a sign to hold the trade longer. Those on the sidelines may want to get in as there is likely more room for the price to run. While this can be a favorable entry, it is not as favorable as entering after a breakaway gap.
Exhaustion Gaps
An exhaustion gap occurs at the end of a trend, often after a significant price increase. The gap higher after a strong advance shows euphoria, where the last remnants of those on the sidelines enter into the trade. With no one left to keep pushing the price up, there is a gap higher followed by a gap lower or a strong selloff.
Volume will either be lower than on prior runaway gaps, or it may be significantly higher. The lower volume shows that fewer people are participating in this latest gap, signaling the trend's exhaustion. On the other hand, a significant volume spike of two or three times the volume on prior spikes also indicates a reversal because with that many people getting in it is questionable how many traders will be left to keeping pushing the price in that direction.
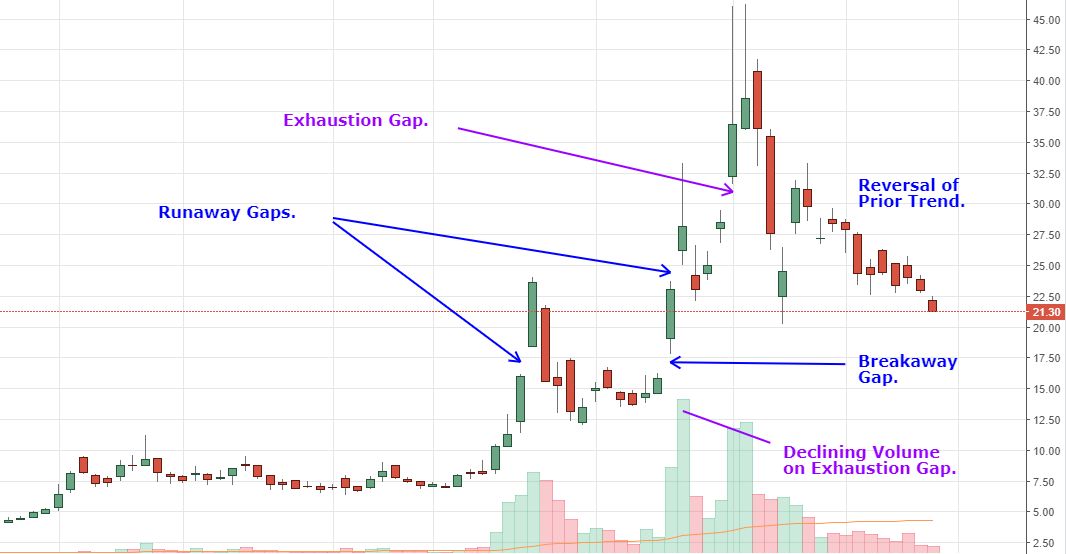
Exhaustion gaps only signal the trend is near an end, and may not mark the exact turn point in the other direction. The price may continue to move in the trending direction for a few more days (or price bars), often with extreme volatility.
It is sometimes only clear after the fact, once the reversal has started, as to whether it is a breakaway gap or an exhaustion gap. The pattern still provides insight though, because following an exhaustion gap the price will rarely revisit those extreme price levels for a long time. In other words, when the price reverses it typically trends in that direction for a long time.
Island Reversal
An island reversal is a pattern composed of a gap in the trending direction, a mostly sideways period for the price, then a gap in the other direction. The price does not return to where the sideways period occurred, making it look like an island on the chart. The "sideways" period can be as little as one price bar, or multiple price bars.
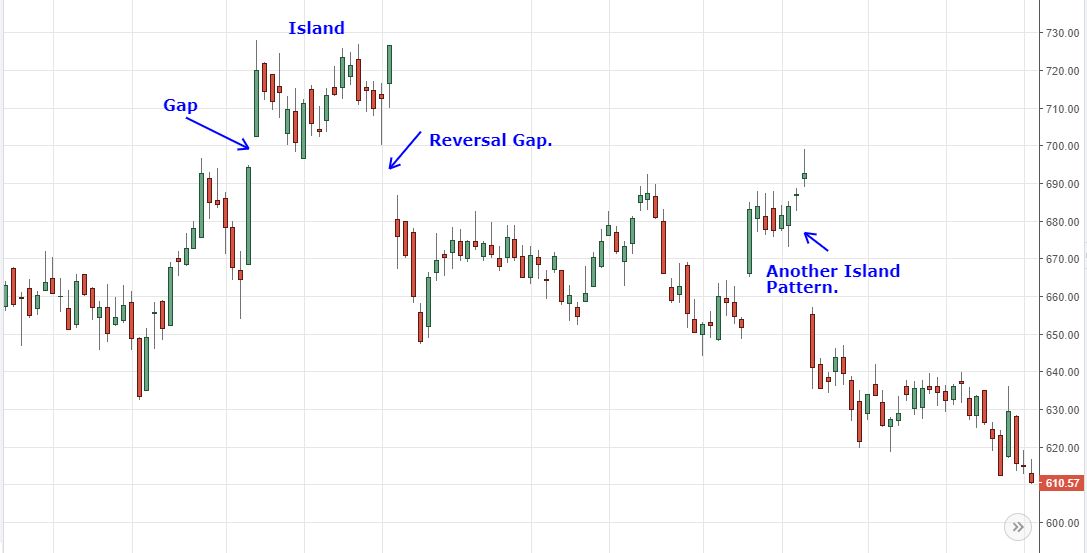
The island is a strong reversal pattern, because it leaves many traders trapped in trades at poor prices (the island). When the price gaps the other way, they are forced to get their trades, fuelling the trend in the other direction.
The island is often not tested again for some time because a new trend unfolds in the reversal direction.
Analyzing Chart Patterns: Triple Tops And Bottoms
-
 Investing
How Gap Plans to get Back in Style (GPS)
Gap is currently out of style. Here's how it plans to change that. -
 Trading
Advanced Candlestick Patterns
Learn how to identify and trade the island reversal, kicker, hook reversal and three gap advanced candlestick patterns. -
 Trading
Shorts Ready to Reload Facebook Positions (FB)
Facebook has bounced into steep resistance at the November breakaway gap and should sell off in coming days. -
 Investing
A Gap in Gap's Announced Store Closings (GPS)
A reduction of store count could be a bad sign for the clothing retailer. -
 Trading
Apple Stock: Traders Should Wait for $170 to Buy
Hidden long-term resistance suggests that Apple shares will turn lower and fill the May gap between $169 and $174. -
 Investing
Old Navy Boosts Gap: Is a Turnaround Likely? (GPS)
Thanks to Old Navy Gap's June comps came in strong. How likely is a turnaround? -
 Investing
Gap Tries to Recapture '90s Magic with Retro Line
Like many stores at the mall, Gap (NYSE: GPS) has been struggling to recapture its past glories. During the 1980s and 1990s, the brand was hip, hot, and in heavy demand. But in recent years, ... -
 Trading
McDonald's Price Levels to Watch After Earnings
McDonald's got hit with an initial sell-the-news reaction after a mixed earnings report but should recover quickly and test 2017 highs.


