Beginner's Guide To MetaTrader 4: Basic Navigation
By Jean Folger
MetaTrader Navigation/Main Window
By default, MT4 opens with four chart windows, each representing a different currency pair. The toolbars, populated with many icons, are located at the top of the screen. Below the toolbars, on the left side of the screen, is the "Market Watch" window, which lists a variety of currency pairs along with corresponding bid and ask prices. Two tabs are located at the bottom of the "Market Watch" window: One is called "Symbols," which shows this list of currency pairs. The other is called "Tick Charts;" this tab can be selected to show the current price activity of any of the currency pairs.
Below the "Market Watch" window is the "Navigator" window. Here, traders can view their account(s), as well as a variety of indicators, "Expert Advisors" and "Scripts." These features will be described in the Advanced Features section of this tutorial.
The "Terminal" appears at the bottom of the screen with six tabs: Trade, Account History, Alerts, Mailbox, Experts and Journal. Traders can click each tab to become familiar with the type of information that appears in each tab. The "Trade" tab, for example, is where open orders and trades can be viewed, including the symbol, trade entry price, stop loss levels, take profit levels, closing price and profit or loss. The "Account History" tab, on the other hand, lists all of the activity that has occurred, including closed orders. Figure 5 shows the different sections of the MT4 screen.
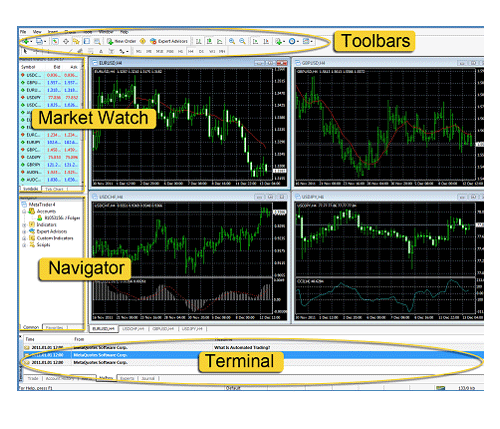 |
| Figure 5: The different sections of the MT4 screen. |
Charts and Settings
The price charts can be customized to reflect the trader's style and color preferences. Right-click on any price chart and select "Properties" to customize the appearance of the chart. Several default color schemes appear in the "Color Scheme" drop-down menu at the top of the "Colors" tab. Traders also have the option to specify colors for each variable, including background, foreground, grid, and bar colors. The "Common" tab allows traders to select if they would like certain features, such as volume, to appear on the chart. Figure 6 shows an example of the "Properties" window pop-up.
[Explore Investopedia's top forex broker reviews to find a broker that fits your trading style.]
 |
| Figure 6: The "Properties" window can be accessed by right-clicking on any price chart and selecting "Properties." |
Templates
Once a color scheme has been selected, it can be saved as a template. Click on the "Template" icon ![]() in the top toolbar and select "Save Template." Give the template a name, and the new template will appear in the drop-down list of templates. This template can now be applied to any chart simply by clicking on the "Template" icon and selecting the desired template from the drop-down list. Price Bars
in the top toolbar and select "Save Template." Give the template a name, and the new template will appear in the drop-down list of templates. This template can now be applied to any chart simply by clicking on the "Template" icon and selecting the desired template from the drop-down list. Price Bars
Traders can also select how price will appear on each chart. With a chart selected, click on the desired icon ![]() to apply bar, candlestick or line price data. Hovering the cursor over any icon will cause the icon's name to appear. This is helpful when learning the function of each icon. The chart type can also be selected by clicking "Charts" in the top toolbar and choosing the desired type from the drop-down menu.
to apply bar, candlestick or line price data. Hovering the cursor over any icon will cause the icon's name to appear. This is helpful when learning the function of each icon. The chart type can also be selected by clicking "Charts" in the top toolbar and choosing the desired type from the drop-down menu.
Indicators
A variety of technical analysis indicators can be added to any price chart. Click on the "Add Indicators" icon ![]() in the top toolbar to view a list of available indicators and make a selection. Figure 7 shows an example of the "Add Indicators" drop-down menu. This menu can also be accessed by clicking "Insert" on the top toolbar and selecting "Indicators." Many indicators are categorized under the type of indicator, such as trends, oscillators and volumes, and can be found under the appropriate heading. Once an indicator is selected, the trader will have the option to change inputs, such as moving average length, or use the default settings. The indicator will then appear on the price chart.
in the top toolbar to view a list of available indicators and make a selection. Figure 7 shows an example of the "Add Indicators" drop-down menu. This menu can also be accessed by clicking "Insert" on the top toolbar and selecting "Indicators." Many indicators are categorized under the type of indicator, such as trends, oscillators and volumes, and can be found under the appropriate heading. Once an indicator is selected, the trader will have the option to change inputs, such as moving average length, or use the default settings. The indicator will then appear on the price chart.
 |
| Figure 7: Click on the "Add Indicators" icon in the top toolbar to access a list of technical indicators that can be applied to any price chart. |
Chart Size
Any price chart can be closed, maximized, minimized or restored by right-clicking on the chart's tab under the chart windows. Figure 8, for example, shows the window and corresponding choices that appear after right-clicking on the tab for the EURUSD currency pair.
 |
| Figure 8: Each chart can be closed, maximized, minimized or restored by right-clicking on the currency pair\'s tab under the chart window. |
Zoom
Traders may find it helpful at times to be able to take a closer look at a price chart. The top toolbar's "Zoom In" and "Zoom Out" icons ![]() can be clicked to get a different view of the chart. The "Zoom In" feature allows traders to take a closer look at a smaller data set; each successive click on the "Zoom In" icon will provide a more close-up view of the chart. The opposite holds true for the "Zoom Out" icon, which can be clicked to return the chart to its original appearance.
can be clicked to get a different view of the chart. The "Zoom In" feature allows traders to take a closer look at a smaller data set; each successive click on the "Zoom In" icon will provide a more close-up view of the chart. The opposite holds true for the "Zoom Out" icon, which can be clicked to return the chart to its original appearance.
Time Frames
Different time frames can be applied to a chart either by clicking on the "Periods" icon ![]() or by selecting the desired time frame from the toolbar, as shown in Figure 9. M1 represents a one-minute time frame, M5 a five-minute time frame, H1 a one-hour, and so on. Many traders like to watch the same trading symbol on multiple time frames. If monitor space is an issue and multiple charts of the same symbol are not practical, traders can switch back and forth between time frames using these easy-to-access toolbar icons.
or by selecting the desired time frame from the toolbar, as shown in Figure 9. M1 represents a one-minute time frame, M5 a five-minute time frame, H1 a one-hour, and so on. Many traders like to watch the same trading symbol on multiple time frames. If monitor space is an issue and multiple charts of the same symbol are not practical, traders can switch back and forth between time frames using these easy-to-access toolbar icons.
 |
| Figure 9: Different time frames can be applied to a chart by clicking on the "Periods" icon and selecting from the drop-down list, or by clicking on the desired icon in the toolbar. |
Drawing Tools
Traders can use a variety of drawing tools to enhance their market analysis. Objects such as vertical lines, horizontal lines, trendliness, channels and Fibonacci Retracements can be drawn. Each drawing tool has its own icon ![]() located in the toolbar. Additional drawing tools, such as Gann lines, can be found by clicking "Insert" on the top toolbar and selecting from a variety of tools.
located in the toolbar. Additional drawing tools, such as Gann lines, can be found by clicking "Insert" on the top toolbar and selecting from a variety of tools.
Connection Status
The bottom right corner of the screen shows a status icon that indicates if the platform is connected to the Internet and capable of receiving market updates. Red bars ![]() indicate there is no connection. Conversely, green bars
indicate there is no connection. Conversely, green bars ![]() indicate there is a connection, and the adjacent number displays the speed of the connection.
indicate there is a connection, and the adjacent number displays the speed of the connection.
Beginner's Guide To MetaTrader 4: Setting up a Trade