


|
Profitable Pattern Number One
The Symmetrical Triangle: A Reliable Workhorse
You’ll recognize the symmetrical triangle pattern when you see a stock’s price vacillating up and down and converging towards a single point. Its back and forth oscillations will become smaller and smaller until the stock reaches a critical price, breaks out of the pattern, and moves drastically up or down.
The symmetrical triangle pattern is formed when investors are unsure of a stock’s value. Once the pattern is broken, investors jump on the bandwagon, shooting the stock price north or south.

Symmetrical Triangle Pattern - To form your symmetrical triangle pattern, draw two converging trend lines that bound the high and low prices. Your trend lines should form (you guessed it) a symmetrical triangle, lying on its side.
How to Profit from Symmetrical Triangles
Symmetrical triangles are very reliable, allowing you to profit from upwards or downwards breakouts. You’ll learn more about how to earn from downtrends when we talk about maximizing profits.
If you see a symmetrical triangle forming, watch it closely. The sooner you catch the breakout, the more money you stand to make.
Watch For:
- Sideways movement: A period of rest before the breakout.
- Price of the asset traveling between two converging trend lines.
- Breakout three-quarters of the way to the apex.
Set Your Target Price:
As with all patterns, knowing when to get out is as important as knowing when to get in. Your target price is the safest time to sell, even if it looks like the trend may be continuing.
For symmetrical triangles, sell your stock at a target price of:
- Entry price plus the pattern’s height for an upward breakout.
- Entry price minus the pattern’s height for a downward breakout.
Symmetrical Triangles in Action
If you’re not sure you can spot a symmetrical triangle on your own, be sure to sign up for our Chart Advisor Newsletter to receive charts of the day picked by our writers.
Ascending/Descending Triangle
-
 Trading
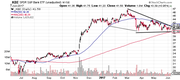
Four Triangle Patterns to Keep An Eye On
These four stocks are consolidating in triangle patterns following big moves. A breakout could kick start another significant price trend. -
 Trading
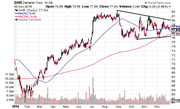
Watch for a New Year Breakout in These Stocks (DHR, FIS)
The narrowing price patterns in these stocks can't last for long. Watch for a breakout. -
 Investing
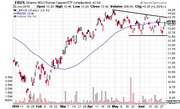
Stocks with Breakout Potential (MDT, SLM)
Stocks are moving within narrowing price bands and are poised for a breakout. -
 Trading
Continuation Patterns: An Introduction
Learn the most common varieties of continuation patterns and how they work in market analysis. -
 Investing
ETFs with Major Breakout Potential (ASHR, IEMG)
These ETFs are moving in price patterns, that when broken, could set up big trending moves. -
 Trading
Waiting on a Breakout in Banking and Financial ETFs
These financial ETFs are stuck in a triangle pattern after a strong rally. Watch for the breakout, in either direction. (KBE,IYG) -
 Trading
Awaiting These Major Breakouts (DIS, NFLX)
These three stocks are moving in patterns that can't last. Watch for the breakout.