


|
Profitable Pattern Number Two
Ascending and Descending Triangles: The Traditional Bull and Bear
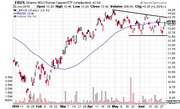
When you notice a stock has a series of increasing troughs and the price is unable to break through a price barrier, chances are you are witnessing the birth of an ascending triangle pattern.

Ascending Triangle Pattern - Confirm your ascending triangle pattern by drawing a horizontal line tracing the upper price barrier and a diagonal line tracing the series of ascending troughs.
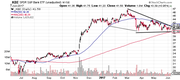
The descending triangle is the bearish counterpart to the ascending triangle.

Descending Triangle Pattern - Confirm your descending triangle by drawing a horizontal line tracing the lower price barrier and a diagonal line tracing the series of descending troughs.
The ascending and descending patterns indicate a stock is increasing or decreasing in demand. The stock meets a level of support or resistance (the horizontal trend line) several times before breaking out and continuing in the direction of the developing up or down pattern.
How to Profit from Ascending and Descending Triangles
Ascending and descending triangles are short-term investor favorites, because the trends allow short-term traders to earn from the same sharp price increase that long-term investors have been waiting for. Rather than holding on to a stock for months or years before you finally see a big payday, you can buy and hold for only a period of days and reap in the same monster returns as the long-time stock owners.
As with many of our favorite patterns, when you learn to identify ascending and descending triangles, you can profit from upwards or downwards breakouts. That way, you’ll earn a healthy profit, regardless of where the market is going.
Watch For:
- An ascending or descending pattern forming over three to four weeks.
Set Your Target Price:
For ascending and descending triangles, sell your stock at a target price of:
- Entry price plus the pattern’s height for an upward breakout.
- Entry price minus the pattern’s height for a downward breakout.
Ascending and Descending Triangles in Action
Ascending and descending triangles are some of the most popular patterns, because their features are clear and the breakouts are almost always fast and furious. Sign up to the Chart Advisor newsletter to stay on top of the latest patterns we're tracking.
Head and Shoulders
-
 Trading
Triangles: A Short Study in Continuation Patterns
Learn how to read these formations of horizontal trading patterns. -
 Trading
Alphabet Stock Set to Rally 20%
An ascending triangle chart formation suggests potential upside for shares of the tech giant. -
 Trading
4 Triangle Breakouts Close At Hand
Triangle breakouts are close at hand in these four stocks. Here's how to trade them. -
 Trading
Hudson Pacific Properties Stock Set to Break Out
An ascending triangle chart pattern suggests upside potential for shares of the real estate investment trust. -
 Investing
Stocks with Breakout Potential (MDT, SLM)
Stocks are moving within narrowing price bands and are poised for a breakout. -
 Trading
Continuation Patterns: An Introduction
Learn the most common varieties of continuation patterns and how they work in market analysis. -
 Investing
ETFs with Major Breakout Potential (ASHR, IEMG)
These ETFs are moving in price patterns, that when broken, could set up big trending moves. -
 Trading
Waiting on a Breakout in Banking and Financial ETFs
These financial ETFs are stuck in a triangle pattern after a strong rally. Watch for the breakout, in either direction. (KBE,IYG)