|
Profitable Pattern Number Three
Head and Shoulders: A Chart Advisor Staple
The head and shoulders pattern is a prevailing pattern among short sellers (investors who profit from downtrends). After three peaks, the stock plummets, offering a textbook, high-return opportunity to traders who catch the trend early.

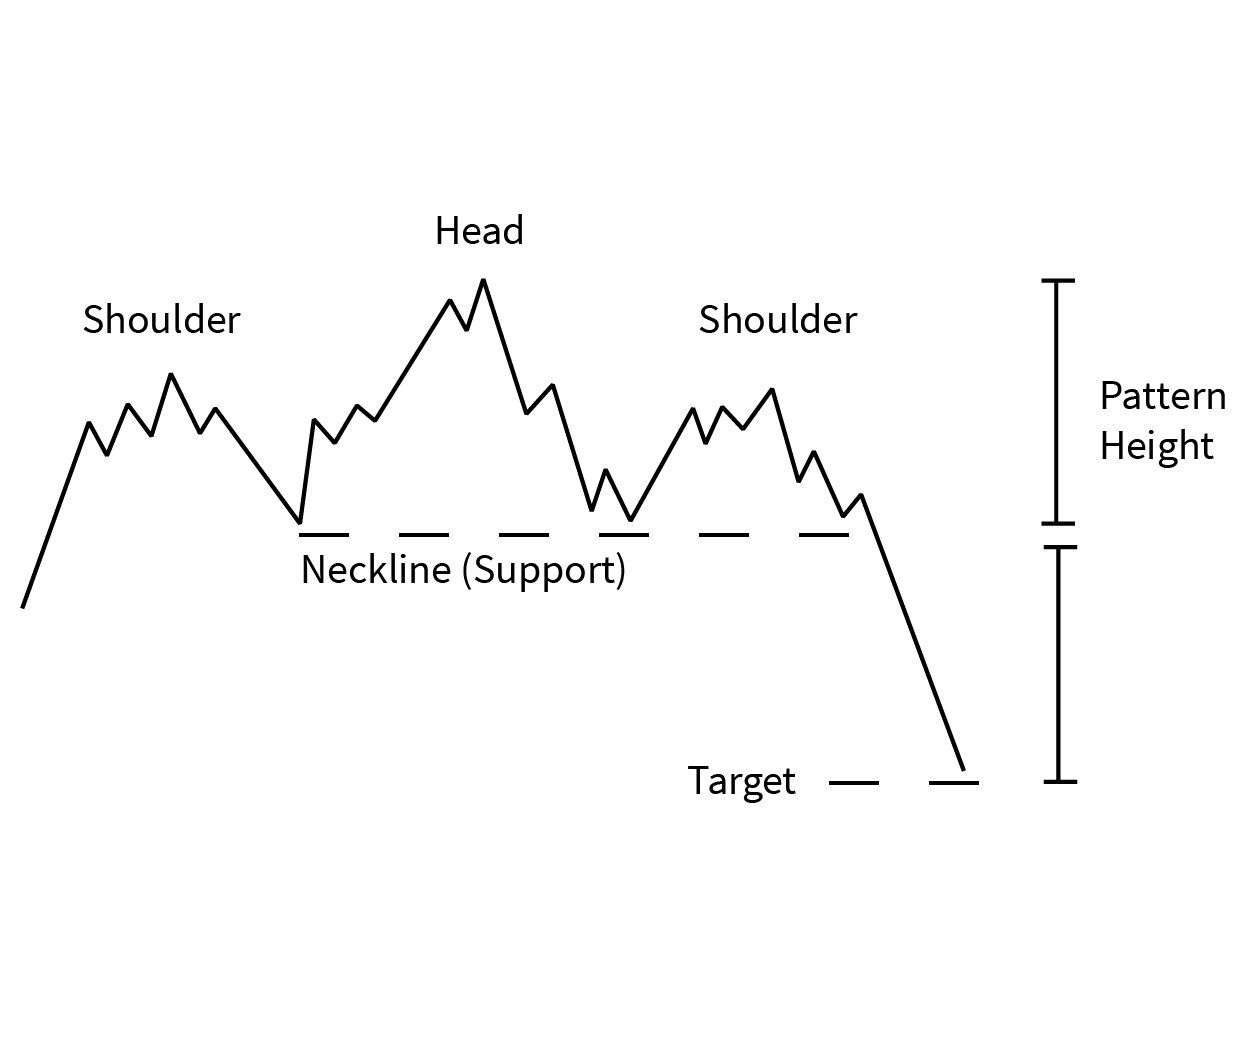
Head and Shoulders Pattern - Head and shoulder patterns are characterized by a large peak bordered on either side by two smaller peaks. Draw one trend line, called the neckline, connecting the bottom of the two troughs.
The first trough is a signal that buying demand is starting to weaken. Investors who believe the stock is undervalued respond with a buying frenzy, followed by a flood of selling when traders fear the stock has run too high. This decline is followed by another buying streak, which fizzles out early. Finally, the stock declines to its true value, below the original price.
How to Profit from the Head and Shoulders Pattern
Short sell as soon as the price moves below the neckline, after the descent from the right shoulder.
Set Your Target Price:
For the head and shoulders pattern, buy shares at a target price of:
- Entry price minus the pattern’s height (distance from the top of the head to the neckline).
Double/Triple - Bottom/Top
-
 Investing
4 Stocks With Bullish Head and Shoulders Patterns for 2016 (PG, ETR)
Discover analyses of the top four stocks with bullish head and shoulders patterns forming in 2016, and learn the prices at which they should be considered. -
 Trading
Inverse Head and Shoulders Patterns Breaking Out
Watch for higher prices if these stocks complete inverse head and shoulders patterns (a bottoming pattern). -
 Trading
Facebook Stock May Complete Head and Shoulders Top
Facebook may succumb to growing controversy, completing the last stage of a head and shoulders breakdown that targets the $130s. -
 Trading
United Technologies Stock Nears Major Breakout
Dow component United Technologies could break 2015 resistance in coming weeks and head toward $160. -
 Trading
Stock Chart Patterns to Keep an Eye On
Some of these stocks are exhibiting big chart patterns, so a breakout is likely to be significant. -
 Trading
Most Commonly Used Forex Chart Patterns
Greatly improve your forex trading by learning these commonly used forex chart patterns that provide entries, stops and profit targets. -
 Trading
Introduction to Technical Analysis Price Patterns
How to recognize price patterns that are key to technical analysis. -
 Trading
Chipotle Breaks Down From Head & Shoulders (CMG)
Chipotle shares broke down from a head and shoulders pattern that could put a halt to their rally this year. -
 Trading
Goldman Sachs Breaks Down from Head & Shoulders
Goldman Sachs recently broke down from its head and shoulders pattern, which could spell a larger fall for the iconic investment bank.


