|
Profitable Patterns Number Four and Five
Double and Triple Bottoms and Tops: Reversals upon reversals
When you see a W or M pattern forming, you may have just discovered a money-making double bottom or double top pattern. These patterns are common reversal patterns used to suggest the current stock trend may be likely to shift.
But don’t panic if your double bottom or double top patterns do not develop as you had originally thought. You haven’t lost your chance to profit. If your W or M pattern reverses for a fourth time, you could now be working with the profitable triple bottom or triple top.
Double Bottom Pattern

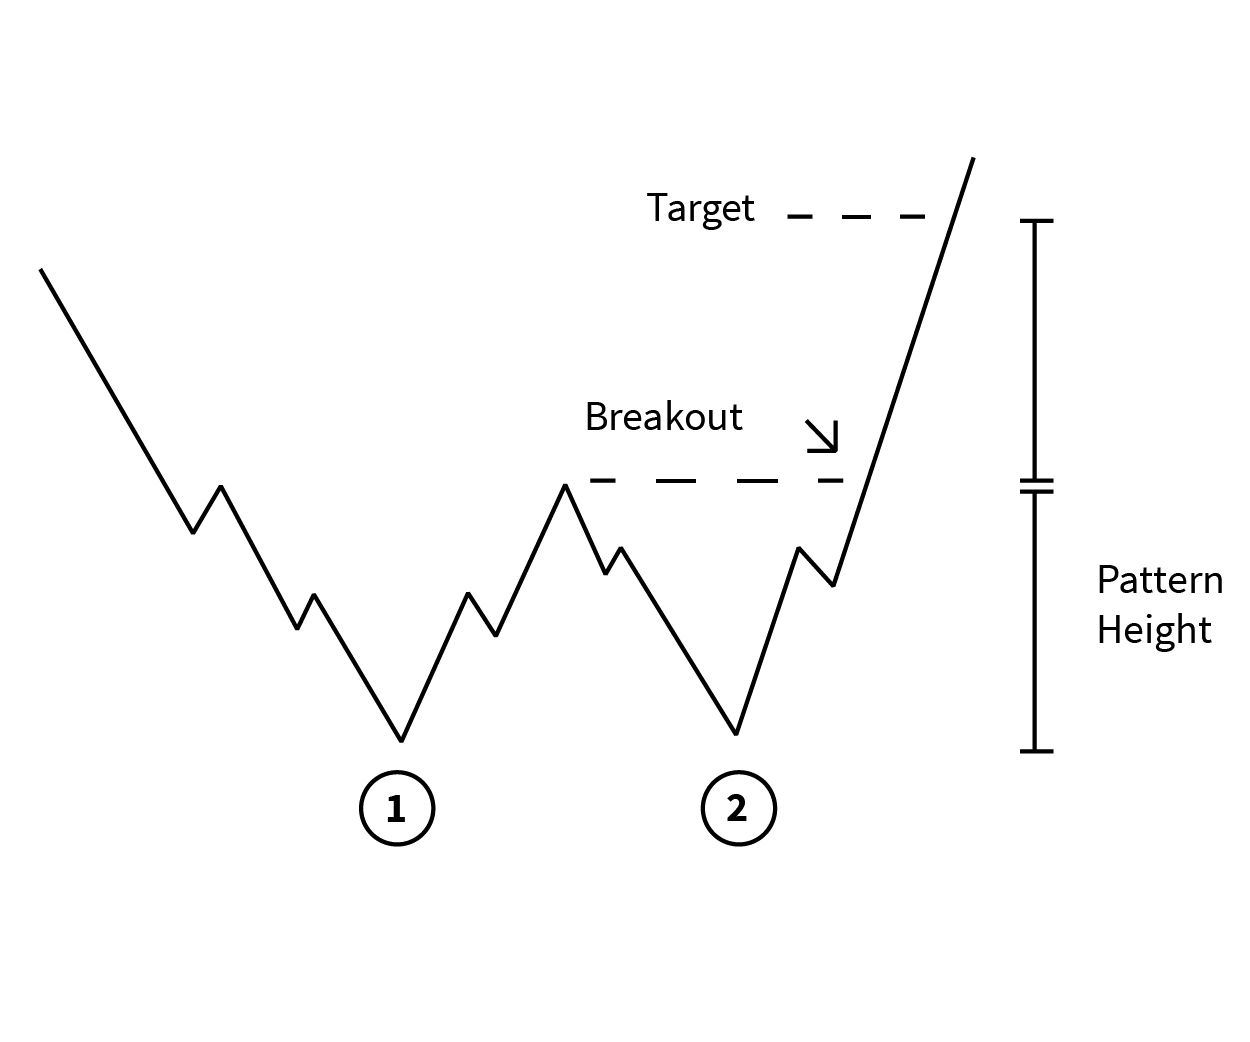
Double Bottom Pattern - A small peak is surrounded by two equal troughs.
Purchase When:
- The price exceeds the middle-peak price.
Watch For:
- A price increase of 10% to 20% from the first trough to the middle peak.
- Two equal lows, not to differ by more than 3% or 4%.
Set Your Target Price:
For the double bottom pattern, sell your stock at a target price of:
- Entry price plus the pattern’s height (distance from the peak to the bottom of the lowest trough).
Double Top Pattern

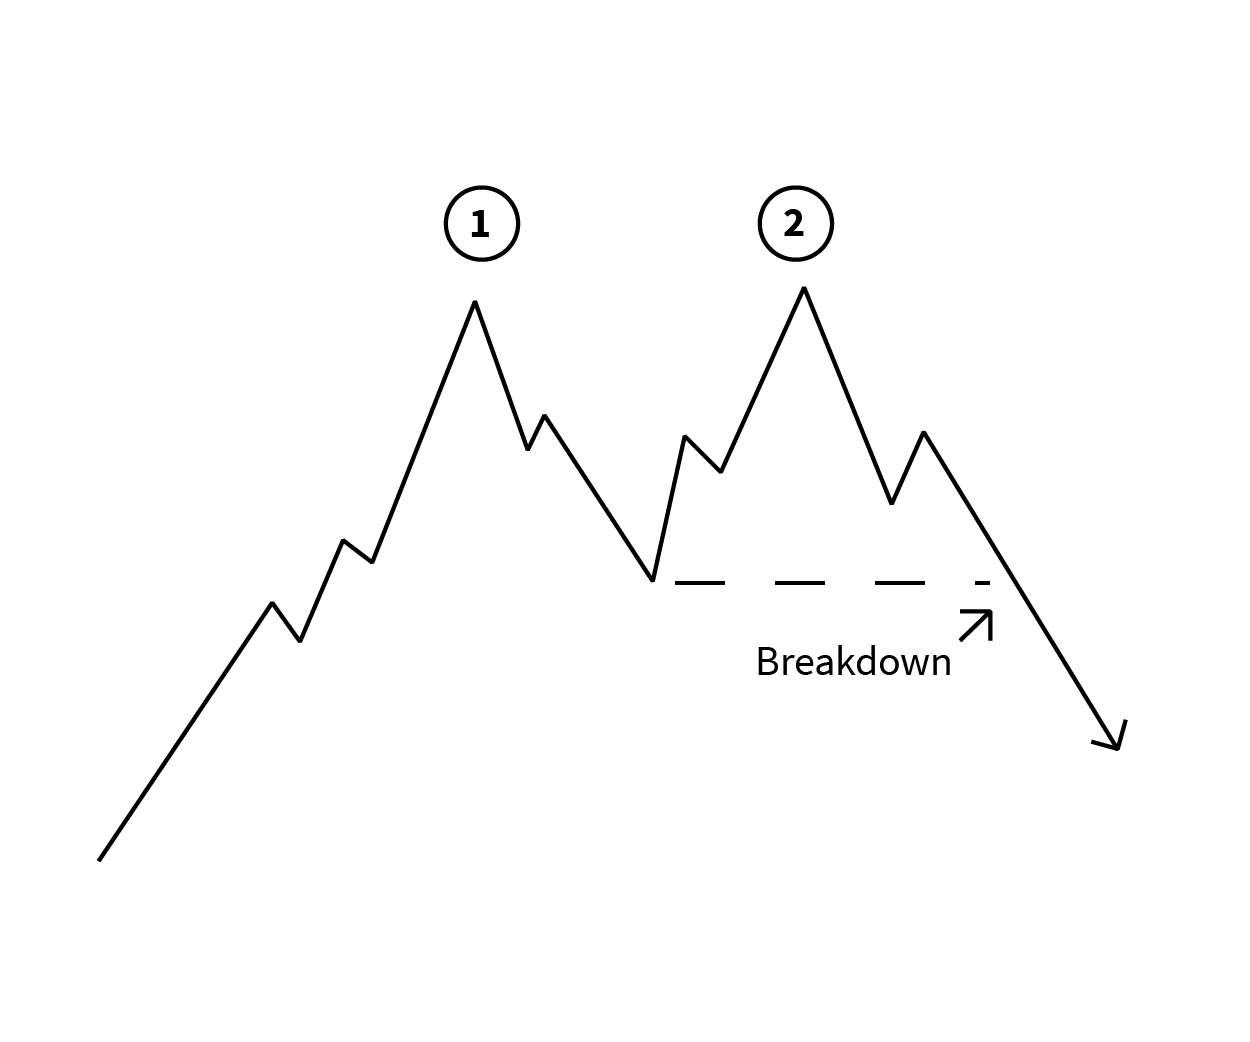
Double Top Pattern - A small trough is surrounded by two equal peaks.
Short Sell When:
- The price drops below the middle-trough price.
Watch For:
- A price decrease of 10% to 20% from the first peak to the middle trough.
- Two equal highs, not to differ by more than 3% or 4%.
Set Your Target Price:
For the double top pattern, buy shares at a target price of:
- Entry price minus the pattern’s height (distance from the trough to the top of the highest peak).
Triple Bottom Pattern

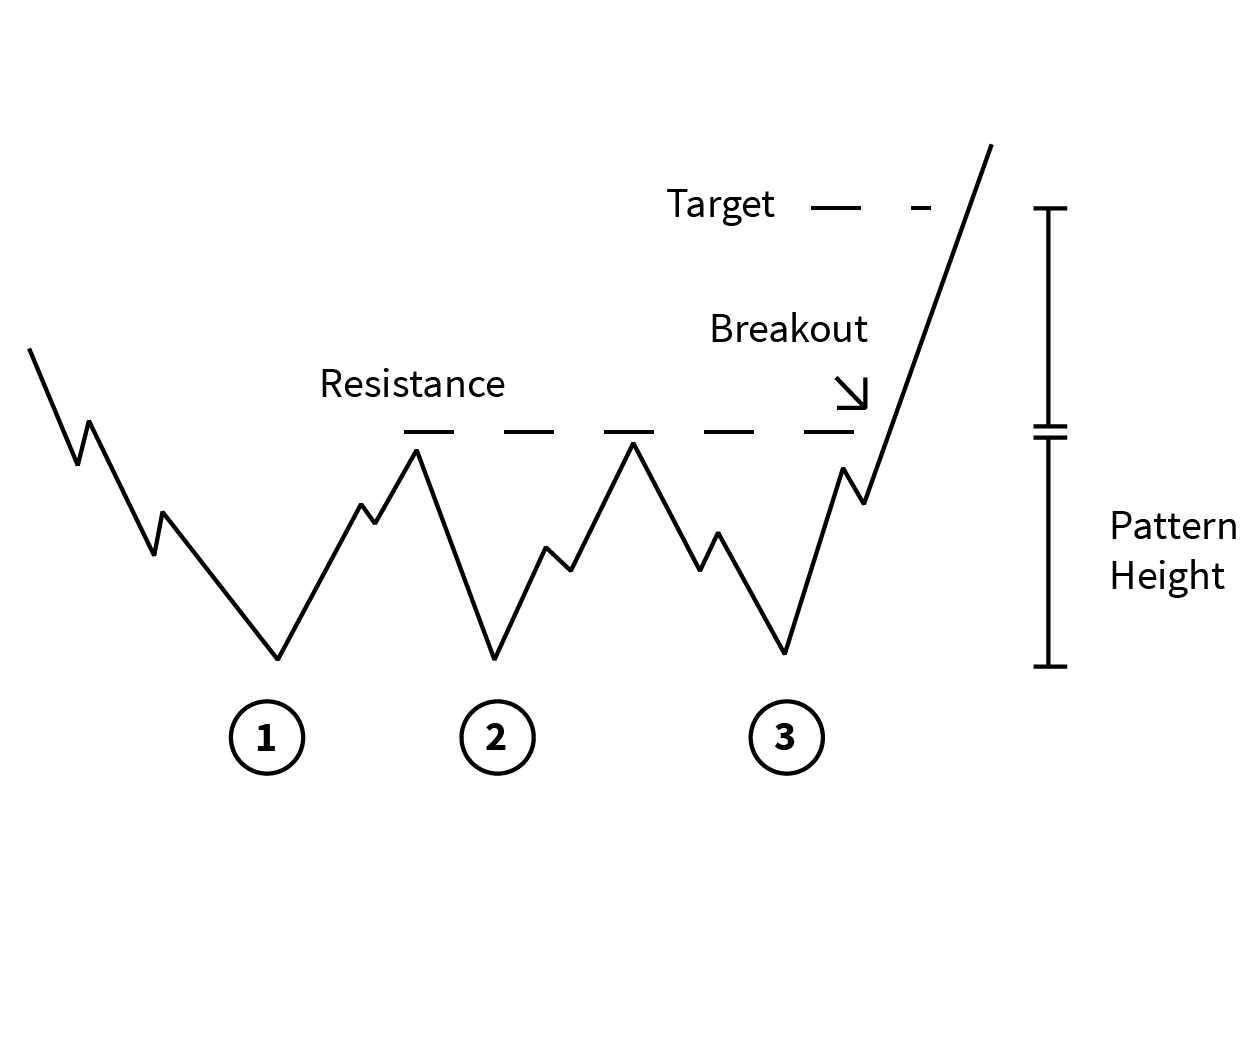
Triple Bottom Pattern - Three equal troughs amid a series of peaks.
Purchase When:
- The price exceeds the resistance established by the prior peaks.
Watch For:
- A series of three identical troughs at the end of a prolonged downtrend.
Set Your Target Price:
For triple bottom patterns, sell your stock at a target price of:
- Entry price plus the pattern’s height (distance from the resistance to the bottom of the lowest trough).
Triple Top Pattern

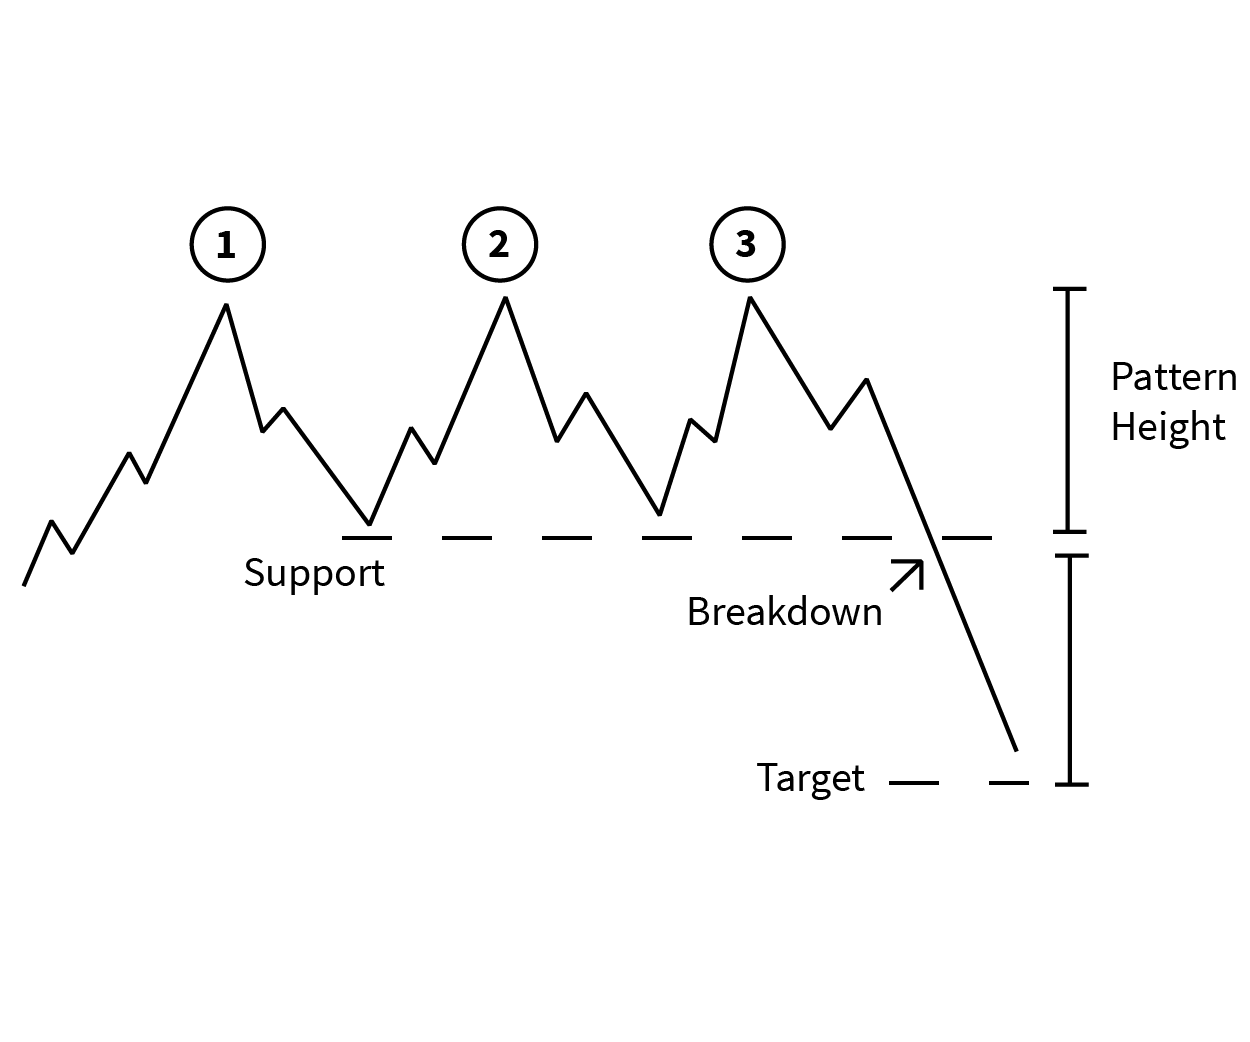
Triple Top Pattern - Three equal peaks amid a series of troughs.
Purchase When:
- The price falls below the support that formed from the prior troughs.
Watch For:
- A series of three peaks at relatively the same level.
Set Your Target Price:
For triple top patterns, buy shares at a target price of:
- Entry price minus the pattern’s height (distance from the support to the top of the highest peak).
Now You Know
The five most profitable stock patterns:
- Symmetrical triangle
- Ascending and descending triangles
- Head and shoulders
- Double top and double bottom
- Triple top and triple bottom
You’re halfway through assembling your toolbox. But you still need a couple more tools to ensure high-dollar profits in the market. Before you’re ready to invest, you’ll want to learn how best to cut your losses and maximize your returns. If you're ready to start seeing new charts every day, subscribe to our Chart Advisor newsletter.
Minimizing Risk
-
 Trading
Continuation Patterns: An Introduction
Learn the most common varieties of continuation patterns and how they work in market analysis. -
 Trading
Inverse Head and Shoulders Patterns Breaking Out
Watch for higher prices if these stocks complete inverse head and shoulders patterns (a bottoming pattern). -
 Trading
The Upward Potential for Hartford Financial Stock
Shares of Hartford Financial Services Group are at an inflection point. -
 Trading
How to Trade the Head and Shoulders Pattern
The head and shoulders chart pattern is popular and easy to spot once traders are aware of what they are watching for. -
 Trading
Hudson Pacific Properties Stock Set to Break Out
An ascending triangle chart pattern suggests upside potential for shares of the real estate investment trust. -
 Trading
Danaher Stock Is Ready to Jump 20%
An ascending triangle pattern forming on the chart suggests that Danaher shares could be poised for upside. -
 Trading
Analyzing Chart Patterns
Learn how to evaluate a stock with a few easy-to-identify chart patterns.


