


Here are some of the more important valuation methods, and how you can incorporate them into Excel.
Discounted Cash Flow (DCF)
|
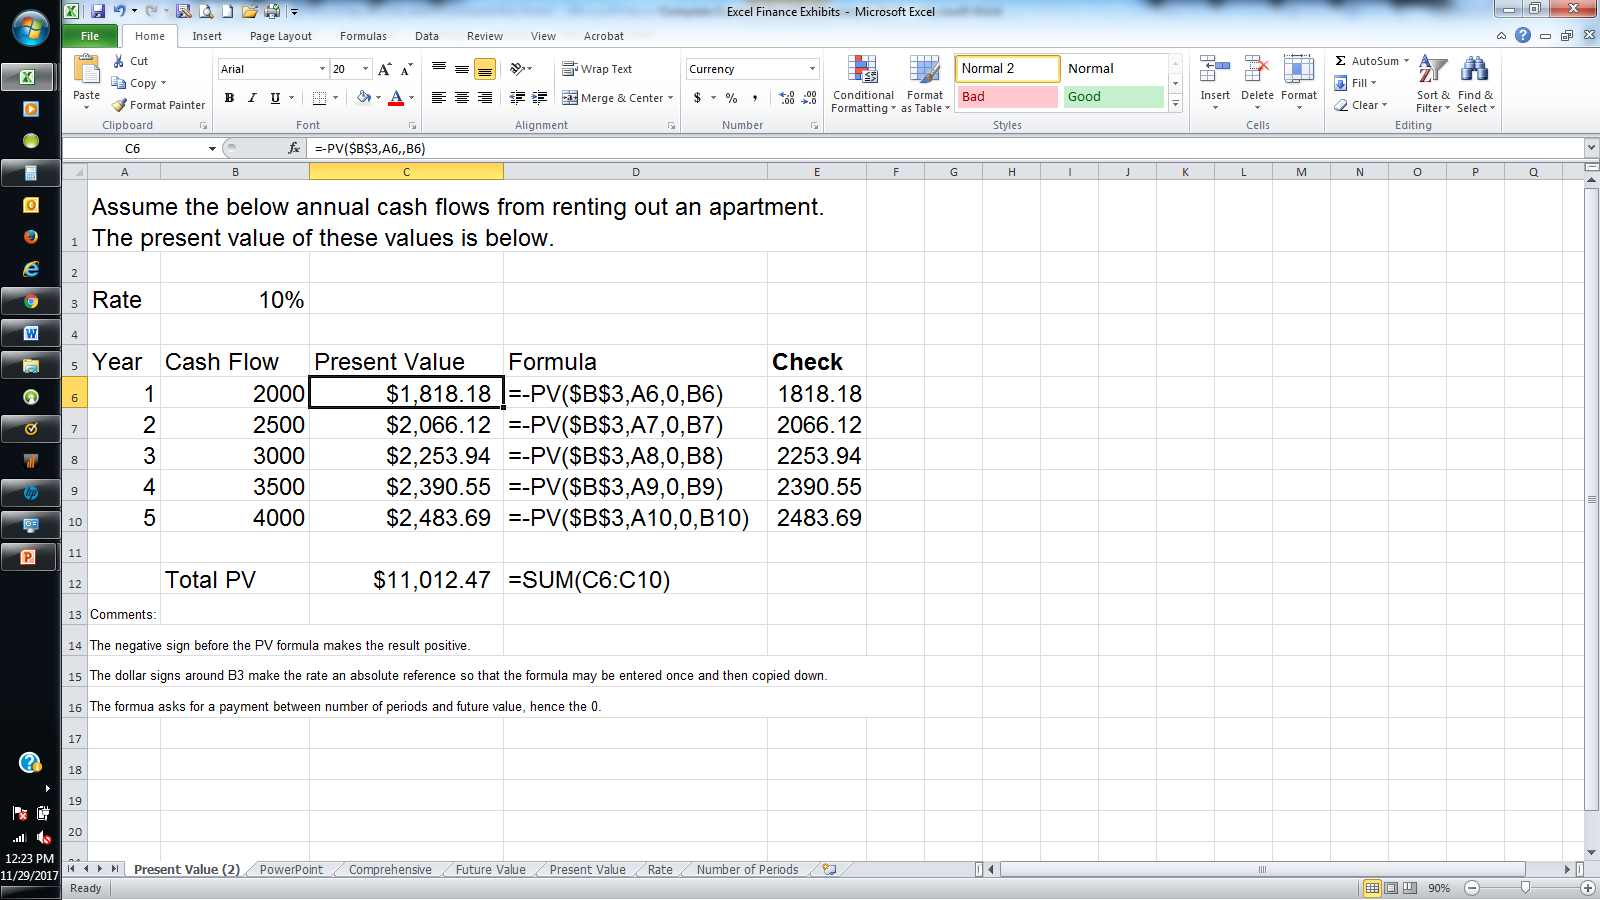
There is not a specific function to run a full discounted cash flow (DCF) model in Excel, but there are a number of tools to make the exercise much more straightforward. But DCF is just the sum of annual cash flows that use a present value (or future value, if we want to know a value in the future). As touched upon in the PV and FV functions on a previous page, it is first necessary to estimate either the present or future value of a security, then also estimate its future cash flows. Discounting these cash flows back by an estimated discount rate will provide a future value. Conversely, starting with a present value and cash flows can allow the user to back into the estimated future value. Here is an example of a PV formula in Excel:
You’ll see that the present values in each year (1 through 5) are added together for a total current present value. To know what the values are at the end of year 5, the future value formula is used. It gets slightly confusing, but the present value here is assuming we are in year 5 (so this is the sum of the future values):
In addition to the above two functions, Microsoft has an IRR function that lets you back into the discount rate, or specifically the internal rate of return, for a series of cash flows. Excel points out that this is very closely related to the PV function, meaning the same inputs are needed, such as an initial present value followed by a string of cash flows The below details a specific cash flow stream for an investment, starting with an initial investment of $70.
|


Bond Valuation
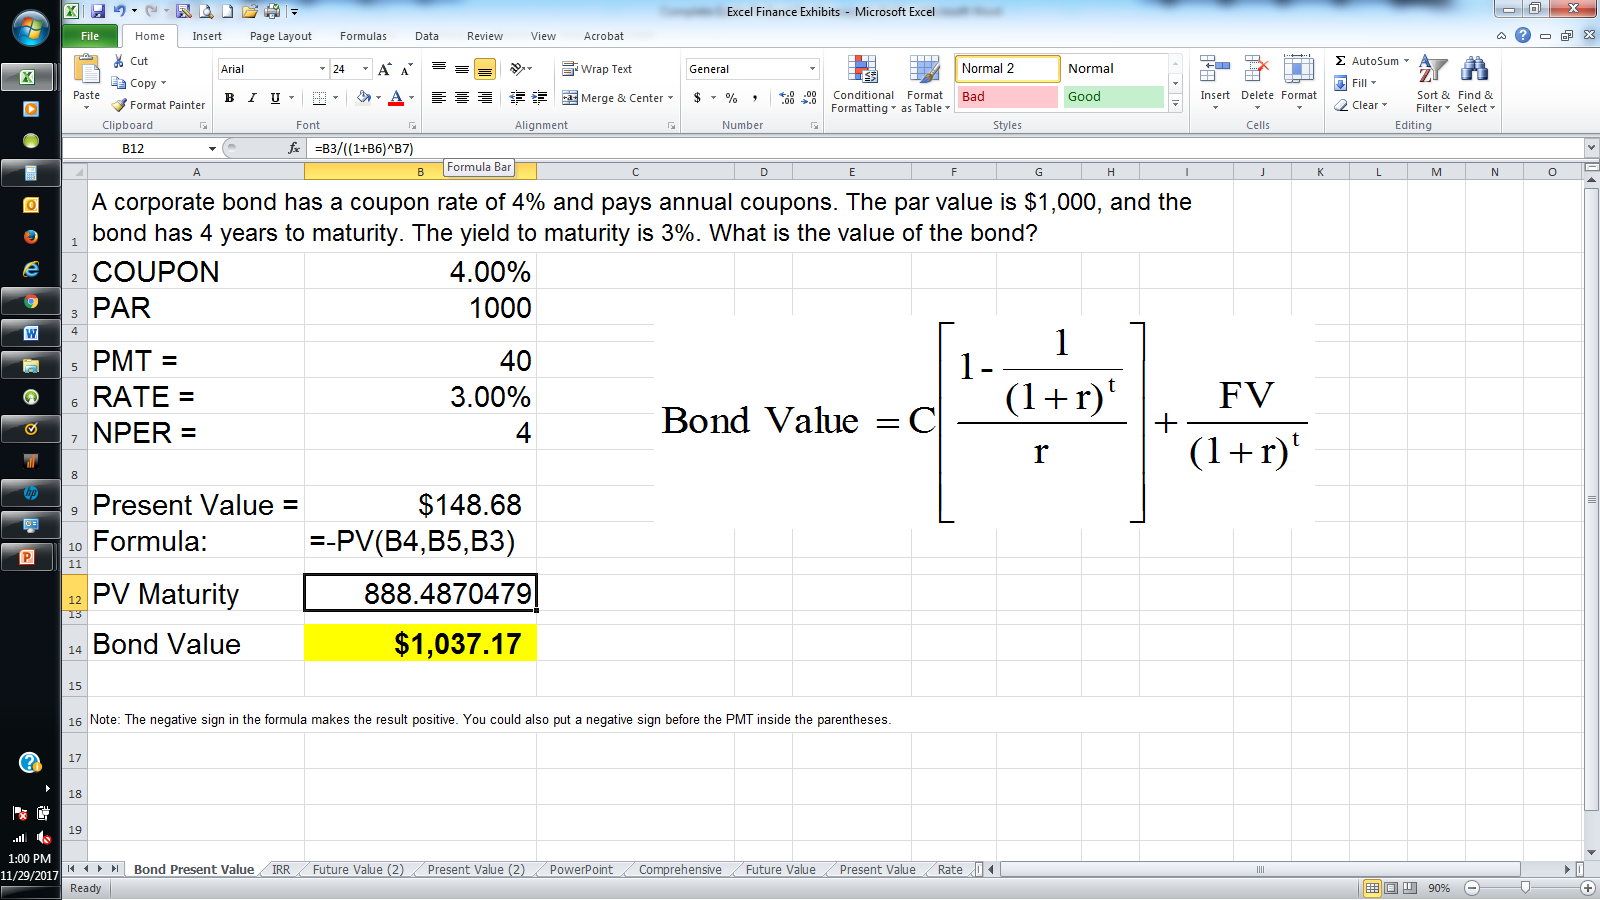
With the above time value of money concepts, many securities can now be valued using Excel. A bond is a relatively easy asset to value because many of the parameters needed to get to a value are already established. Bonds are purchased at par value when they are issued (present value, though this changes), have a set coupon rate (the interest rate), and a set maturity (the time, or number of periods) where an investor receives his initial investment back (future value). A bond is similar to an annuity payment in that there are set cash flows while the bond is owned, then there is the value at the end when the bond matures.
So, essentially a bond’s current value is the present value of its cash flows (annual coupon payments) and the value the investor receives back when the bond matures. Because the cash flows are the same each year, an annuity valuation can be employed. As interest rates change in the marketplace, the bond value can change. Below is an example in Excel to value a bond:
Additionally, the "PRICE" function returns the estimated market value of a bond with a $100 face value. Below are the details of the metrics needed to value such a bond, which happens to be $90.20, based on the inputs provided.

Other bond functions include the ability to calculate a bond's duration, modified duration, yield to maturity, yield, and discount rate. Basically, there is the ability to solve for any variable when valuing a bond. These concepts are beyond the scope of this guide, but other Investopedia resources can lend insight into what they are, and how they can be calculated in Excel.
Stock Valuation – the Dividend Discount Model (DDM)
Time value of money concepts are more straightforward for basic present value, future value, and bond valuation calculations. But as variables grow uncertain, estimations become needed. Valuing a common stock provides a great example. An investor can buy a stock in the stock market at its present value. But the future value is not known (the value the stock can be sold at in the future) and is dependent on uncertain cash flows (dividend payments aren’t always available, can be reduced or increased each year). Finally, there is no maturity date (future value) like a bond. Public companies are going concerns and the underlying common stock therefore doesn’t have a set future value.
The dividend discount model (DDM) represents one of the most basic valuation approaches for a stock. It estimates the value of a stock or company by discounting back its estimated future dividend rates. A number of simplifying assumptions need to be made in the DDM model. A basic model can be built an only requires knowing the current dividend rate, estimated dividend growth rate, and discount rate, or required rate of return. In the real world, the dividend growth rate isn’t so certain.
The DDM is simply:
P0 = (D1 / R - g)
It states that the current stock price is equal to next year’s dividend divided by the discount rate, less the growth rate in the dividend. It is the same formula as for a growing perpetuity. It is a basic formula that can be entered into Excel.
The DDM formula is a key component of any stock valuation model. The valuations grow in complexity from there, but again use the basics above. Dividend payments each year can be discounted back to a present value. If a firm doesn’t pay dividends, its cash flows can be estimated each year (in fact this is the most appropriate stock valuation approach). But at some point, an assumption must be made that the dividend will grow at a constant rate, which will employ the DDM model above.
DCF models as applied to stocks can grow quite complex. There are more complicated ways to look to estimate dividends, including at rates that change over time. Below is an example of just how complicated the exercise can become:
Implied Growth Model
A relatively unique approach to valuing a stock is to solve for the discount rate. As detailed above, a company’s dividend (or cash flow if it doesn’t pay a dividend) will grow for some time at a higher rate, before moving into a perpetual growth rate in the DDM model. Instead of having to spend an inordinate amount of time estimating cash flows, discount rates, and investing time periods, the below information is entered into a spreadsheet.
Using the two-stage stock valuation model, this spreadsheet allows the user to estimate the first-stage growth rate that is necessary to justify the stock's current market price. The user must provide: the current market price of the stock, the current annual cash flow per share, first- and second-stage cost of capital data, terminal growth rates, and the length of the abnormal growth period. The spreadsheet is designed to use the Solver add-in to calculate the value for the abnormal growth rate that sets the difference between the stock's market price and intrinsic value equal to zero.
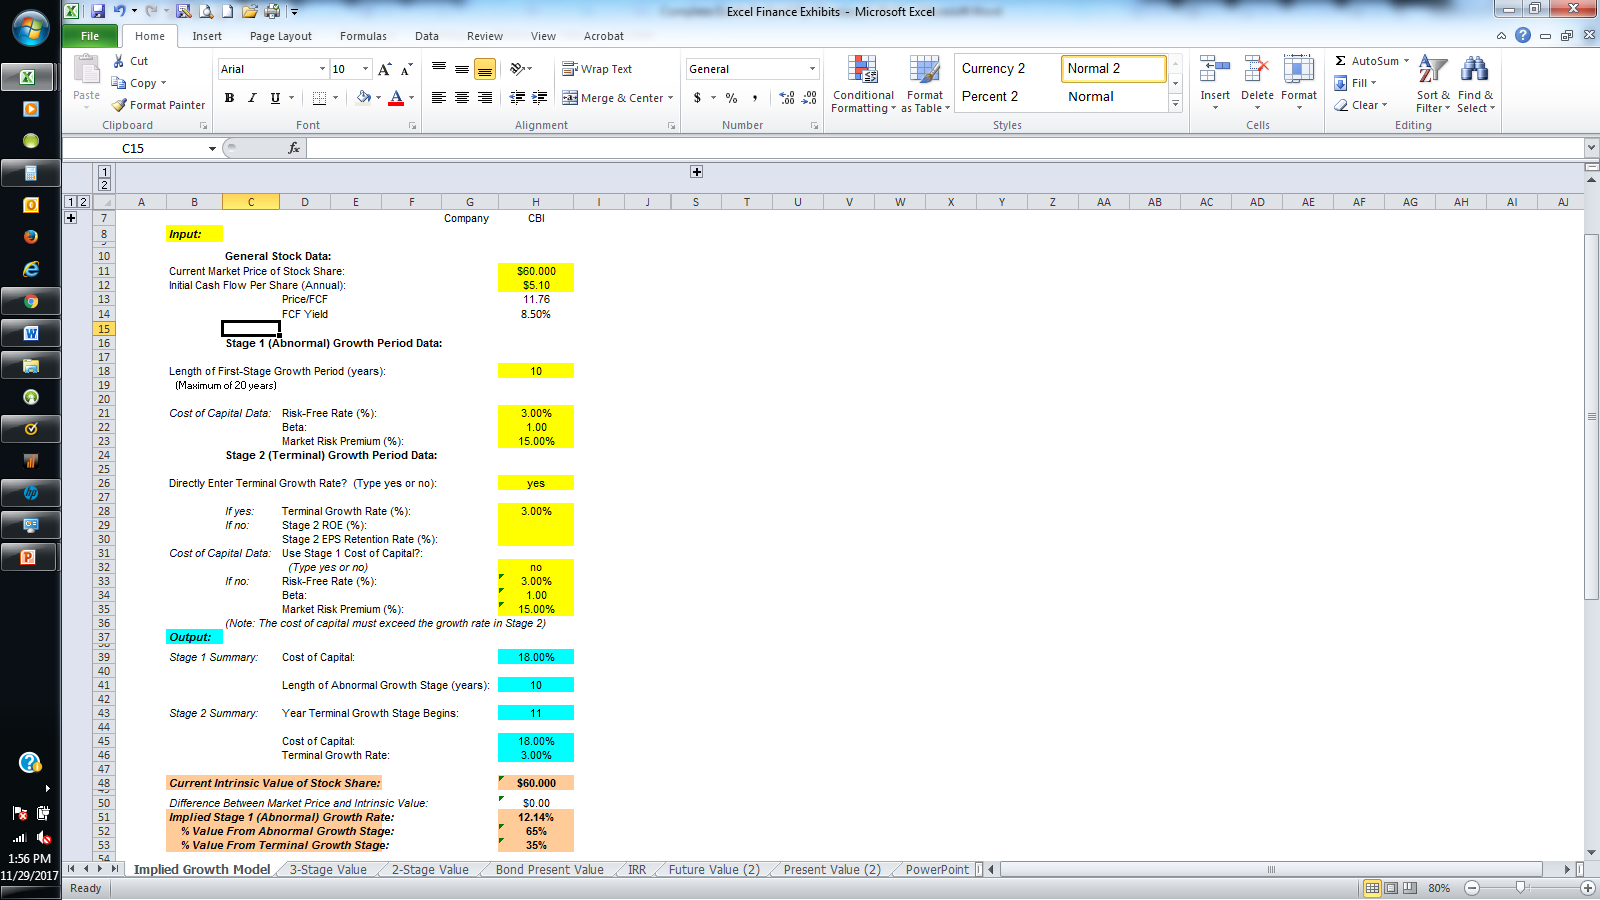
The estimated growth rate is the rate at which cash flows must grow to justify the current share price. In essence, it reduces an investment decision to if an individual thinks a company can grow above, or below that rate. If it can grow faster, the stock is worth buying. If not, the stock should not be purchased, or sold if held currently.
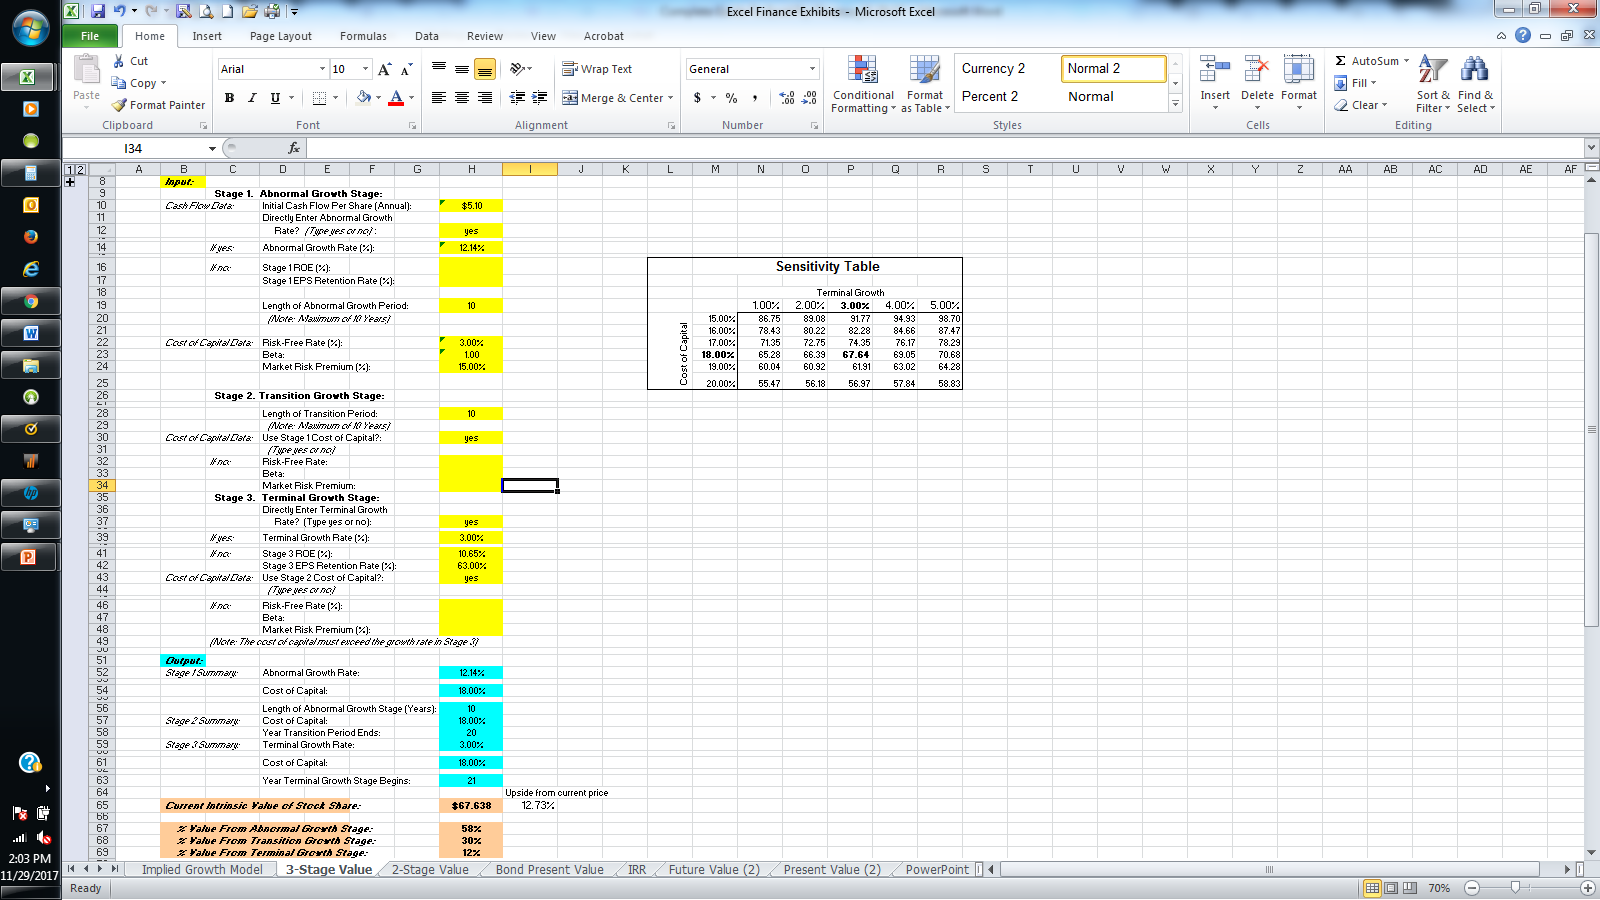
Below is a final example of a “3 stage” valuation model where a company’s dividend/cash flow grows at a fast rate, then takes some time to slow before settling into a steady-state DDM model. This spreadsheet allows the user to calculate the fundamental value of a stock using the three-stage cash flow growth model. The user must input: initial cash flow per share, first-stage and terminal growth data, cost of capital data for all stages, the length of the abnormal growth stage, and the length of the transition stage. A linear adjustment process for transition-stage growth rates is assumed.
Residual Income Model (RIM)
For a final stock valuation model, the residual income model (RIM) is another specialized version of a DCF used to value a firm. In its most basic form, the RIM has an equity charge that is equal to equity capital multiplied by the cost of equity. This is subtracted from net income to get to a residual income figure, which is used in lieu of cash flow or dividends, as calculated in the DCF and DDM models. Residual income figures can easily be modeled and calculated in Excel, but there are a number of steps to get to these calculations.
Below is an example of a full RIM as created in Excel:
|
Name of Firm: |
NewCo |
||
|
Date of Valuation: |
11/22/10 |
||
|
($ and shares in millions) |
|||
|
Growth Rates: |
|||
|
First 5 years |
17.00% |
||
|
Years 6 – 10 |
11.00% |
||
|
After 10 years |
4.00% |
||
|
Capital Retention Rates: |
|||
|
First 5 years |
85.00% |
||
|
Years 6 – 10 |
60.00% |
||
|
After 10 years |
20.00% |
||
|
Past Year Normalized Earnings |
$ 3,688 |
||
|
Beginning Book Value of Equity |
$ 20,119 |
||
|
Expected Rate of Return on Equity |
10.00% |
||
|
Discount Rate |
10.00% |
||
And below are the outputs, as calculated by the above RIM:
|
Book Value |
Present Value of |
||
|
of Equity |
Residual Earnings |
Intrinsic Value |
IV per Share |
|
$ 20,119 |
$66,090 |
$ 86,209 |
$ 37 |
Guide To Excel For Finance: Goal Seek
-
 Investing
What Is The Intrinsic Value Of A Stock?
Intrinsic value reduces the subjective perception of a stock's value by analyzing its fundamentals. -
 Investing
Evaluate Stock Price With Reverse-Engineering DCF
This is a more accurate method to use when trying to find a target price for a stock. -
 Investing
Taking Stock Of Discounted Cash Flow
Learn how and why investors are using cash flow-based analysis to make judgments about company performance. -
 Investing
DCF Valuation: The Stock Market Sanity Check
Calculate whether the market is paying too much for a particular stock. -
 Financial Advisor
Calculate PV of different bond type with Excel
To determine the value of a bond today — for a fixed principal (par value) to be repaid in the future — we can use an Excel spreadsheet. -
 Small Business
Valuing Startup Ventures
Valuing a company is a difficult task, regardless of the size of the business - but here some methods that can help. -
 Investing
Valuing Firms Using Present Value of Free Cash Flows
When trying to evaluate a company, it always comes down to determining the value of the free cash flows and discounting them to today. -
 Investing
How to Value Companies in Emerging Markets
Find out how to value companies from emerging market nations like China and India. Learn how to apply discounted cash flow to their equity valuations.