Triple tops and triple bottoms are reversal patterns. A triple top signals the price is no longer rallying, and that lower prices are on the way. A triple bottom indicates the price is no longer falling and could head higher. Triple tops and bottoms are similar to double tops and bottoms, except in the case of a triple there are three high points (top) and low points (bottom).
Triple Tops
A triple top occurs when the price peaks in the same area on three separate occasions, with pullbacks after the first and second peaks.
The pattern completes when the price drops below the latest pullback low (after the second peak), or breaks the trendline formed by connecting the two pullback lows. When this occurs, short positions may be initiated based on the pattern. Those currently in long trades should question whether they want to hold that trade through another decline.
If the price peaks at $119, pulls back to $110, rallies to $119.25, pulls back to $111, rallies to $118, then drops below $111, that is a triple top and signals the price is likely heading lower.
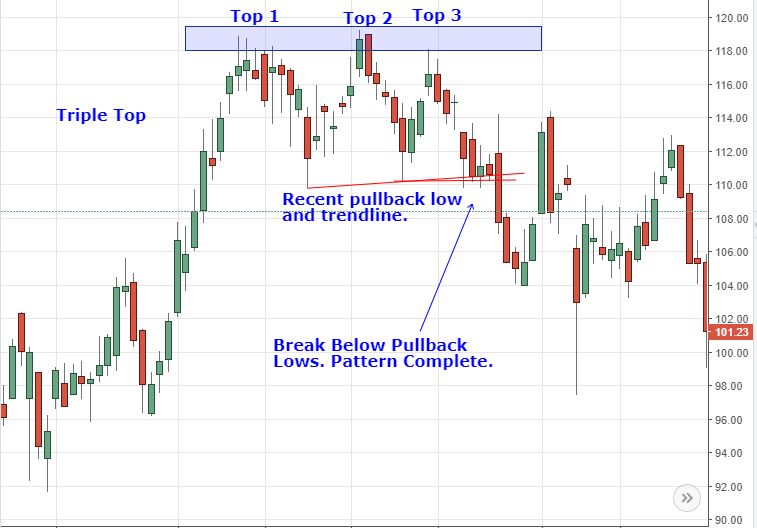
A stop loss on short positions is placed above the latest peak, or above a recent swing high within the pattern. This limits the risk of the trade if the price doesn't drop and instead rallies. Chart pattern don't work all the time.
Price Target
The estimated decline is equal to the height of the pattern subtracted from the breakout point. If the pattern high is $61 and the low of the two pullbacks is $54, subtract $7 from the breakout price when the price falls below $54. This gives a price target of $47. The chart shows another example.
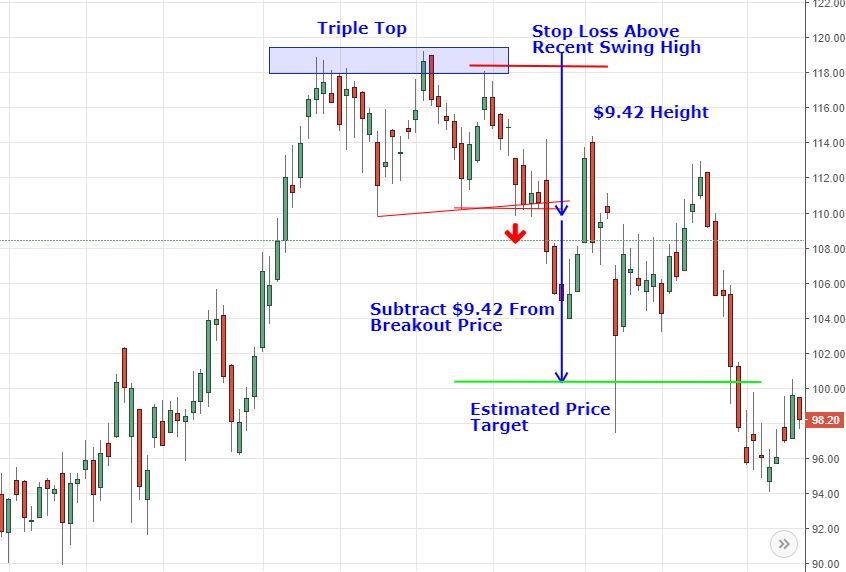
The rationale for the triple top pattern is that uptrends make higher swing highs and higher swing lows. The price tried to move higher three times and couldn't, and then dropped below the pullback low of the pattern. That is evidence that a downtrend is starting, or at minimum the uptrend is in jeopardy.
Triple Bottoms
A triple bottoms is the inverse of a triple top. It occurs after an extended decline, and is when the price reaches the same support area on three separate occasional. After the first and second lows there is a pullback to the upside.
The pattern completes when the price moves above the high of the most recent pullback. Alternatively, the pattern also completes when the price breaks above the trendline formed by connecting the two pullback highs. Consider taking a long position at the breakout point, and beware of short positions.
If the price bottoms at $20, moves up to $22, declines to $19.75, moves up to $21, declines to $19.70, then rallies above $21, the triple bottom is complete. The downtrend is likely over so watch for prices to move higher.
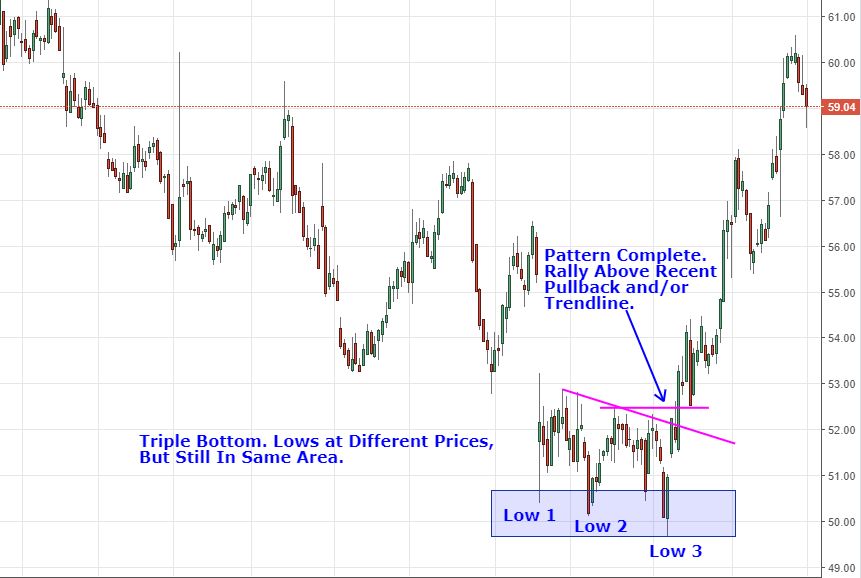
If buying when the pattern completes, place a stop loss below the most recent low of the pattern. Alternatively, to keep the risk smaller, find a swing low to place the stop loss below within the pattern. This helps limit the trade risk if the price doesn't rally and instead drops.
Price Target
Once the pattern completes, traders can use the size of the pattern to estimate how far the price could rally. Take the height of the pattern and add it to the breakout point. If the breakout point is $52.50, and pattern has a height of $3.23, the estimated profit target is $55.73.
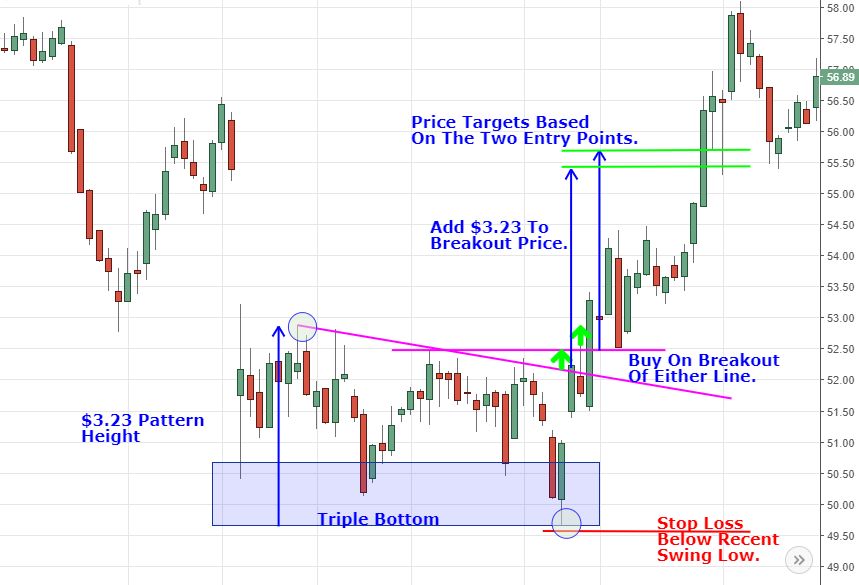
The rationale for trading the triple bottom is that downtrends make lower swing highs and lower swing lows. The price tried to move lower three times, but couldn't break below the support area. The price then rallied above a recent high. That indicates an uptrend, not a downtrend.
Trading Considerations
Two peaks or bottoms always occur before a third. Sometimes when a double bottom doesn't work out it will become a triple bottom. When the price peaks or bottoms more than three times in the same area, the price is likely moving within a range.
As with double tops and bottoms, the risk/reward is a drawback of these triple patterns. Since both the stop loss and target are based on the height of the pattern, they are roughly equal. Patterns where the potential profit is greater than the risk are preferred by most professional traders. By placing the stop loss within the pattern, instead of above it (triple top) or below it (triple bottom) improves the reward relative to the risk. The risk is based on only a portion of the pattern height, while the target is based on the full pattern height.
Triple tops (and bottoms) can look like a head and shoulders patterns, if the middle peak is the highest (lowest) of the three. Since the patterns are traded in essentially the same way, it is of little consequence if the pattern is labeled a head and shoulders or a triple top/bottom.
Depending on which entry points is used—the trendline or the recent pullback high (triple bottom) or low (triple top) —it is possible to have two profit targets since the height of the pattern can be added to either of these breakout points. Traders can choose which target breakout level they prefer. For example, on a triple bottom, a trader may choose to use the higher profit of the two in order to extract more profit from the trade.
Analyzing Chart Patterns: Round Bottoms
-
 Trading
Inverse Head and Shoulders Patterns Breaking Out
Watch for higher prices if these stocks complete inverse head and shoulders patterns (a bottoming pattern). -
 Trading
Global Market ETFs at Breakout Levels
These global market ETFs are breaking through resistance at 52-highs. -
 Trading
How to Trade the Head and Shoulders Pattern
The head and shoulders chart pattern is popular and easy to spot once traders are aware of what they are watching for. -
 Trading
Continuation Patterns: An Introduction
Learn the most common varieties of continuation patterns and how they work in market analysis. -
 Trading
Harmonic Patterns In The Currency Markets
Learn how to take geometric price patterns to the next level by using Fibonacci numbers to predict movements in the forex market.


