


A rounded bottom or saucer bottom can be a continuation or a reversal pattern. It is a cup or bowl formation where there is selling at the left of the pattern, but as time progresses the selling tapers off and the price starts to rise again. The pattern shows the transition from sellers having control to buyers having control.
Reversal Pattern
A rounded bottom reversal signals the end of a downtrend and that prices are starting to rise again. The price is declining, levels off, and then ascends. When the price levels off, it may even form a small double bottom, triple bottom, or head and shoulders pattern.
The pattern is complete when the prices moves back above the starting point of the most recent decline, where the pattern started.

Buy when the pattern completes. Place a stop loss order below swing lows within the pattern that occurred once the price started rising, or place a stop loss below the low of the entire pattern.
Price Target
Rounded bottoms—especially when they occur on daily and weekly charts, lasting several months or more—often signal a strong trend change. Trends may last for a long time. In stock and currency markets trends can last five years or more. Therefore, the rounded doesn't have an accurate long-term price target. Rather, the pattern lets traders know a major new trend could be starting.
For shorter-term traders not looking to capture an entire trend, but only part of it, add the height of the rounded bottom to the breakout point. This provides an estimated target and also allows for a risk/reward ratio to be calculated on the trade (based on the target and stop loss levels).

Continuation Pattern
The rounded bottom continuation pattern doesn't signal the end of an uptrend, but rather occurs in the midst of it. During uptrend, the price may pullback and form a rounded bottom pattern before starting its ascent again. The rounded bottom is one type of pullback that occurs within trends.
During a trend the price pulls back, levels off, and then begins to rise again. This forms the cup or bowl shape, similar to the reversal pattern.
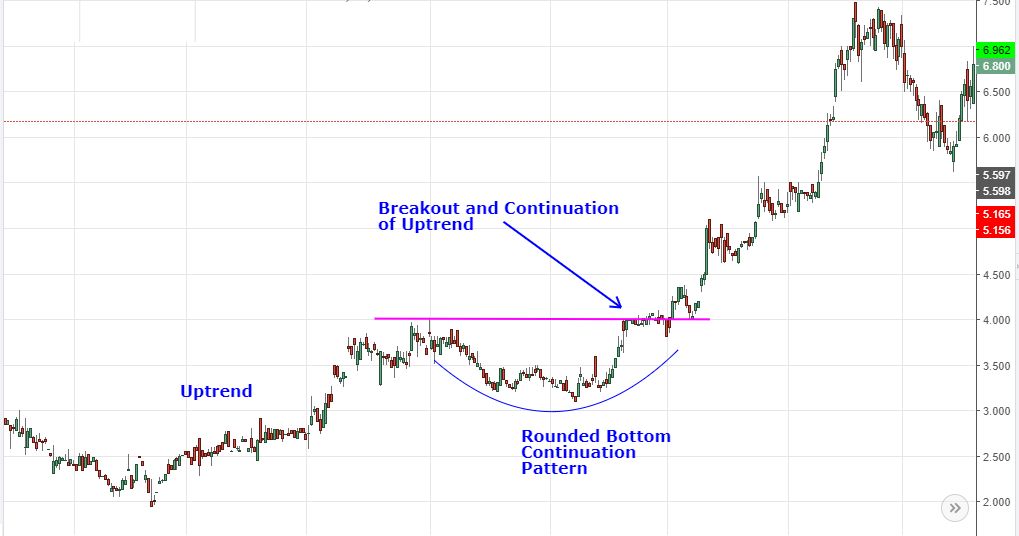
For trading this pattern, consider initiating long positions when the price moves above the prior high (where the pullback started). Traders can also enter earlier than this, when the price has started it transition to the upside but before it reaches the prior high. The latter approach results in a better entry price, but there is no guarantee the pattern will complete. Taking a trade when the pattern completes (breakout) shows the pattern is progressing as expected, but the entry point is worse than if entering earlier.
Place a stop loss order below a recent swing low, or below the low of the entire pattern. This helps control risk in case the price doesn't rally as expected.
Price Target
As with the reversal pattern, add the height of the rounded bottom to the breakout point for an estimated upside target. This aids in assessing the risk/reward of the trade. Depending on how strong the trend is, the price could well exceed the estimated target. In weak trends, or when the trend is near its end , the price may not meet the estimated profit objective. Typically, the stronger the uptrend heading into the rounded bottom the larger the follow-through to the upside after the pattern.

Trading Considerations
This patterns allows for variation on entry point and stop loss location. In turn, the pattern can offer high reward-to-risk, or low reward-to-risk. Buying as the price starts to transition higher, and placing a stop loss below a recent swing low provides high potential reward for the risk, potentially upwards of 4:1 or more. Waiting for the official breakout and placing a stop loss below the low of the pattern equates to a reward:risk of roughly 1:1.
Analyzing Chart Patterns: Conclusion
-
 Trading
Inverse Head and Shoulders Patterns Breaking Out
Watch for higher prices if these stocks complete inverse head and shoulders patterns (a bottoming pattern). -
 Trading
Continuation Patterns: An Introduction
Learn the most common varieties of continuation patterns and how they work in market analysis. -
 Trading
Global Market ETFs at Breakout Levels
These global market ETFs are breaking through resistance at 52-highs. -
 Trading
How to Trade the Head and Shoulders Pattern
The head and shoulders chart pattern is popular and easy to spot once traders are aware of what they are watching for. -
 Trading
Watch for Breakouts in These Commodity ETFs
Major commodities such as oil, gold, and silver are all consolidating in tight patterns following a rally and are poised to breakout. -
 Trading
Cup and Handle Chart Patterns Forming Right Now
A cup and handle is a relatively common chart pattern which can be used in various ways. Here it highlights stocks poised to make new highs. -
 Trading
Use Volume And Emotion To Tackle Topping Patterns
Selling short in a topping pattern offers an advantageous reward-to-risk profile, but it can be hard to find good entry prices. -
 Trading
3 Charts That Commodity Traders Will Want to Watch
Despite recent periods of consolidation on the charts of most commodities, active traders will maintain a bullish bias due to nearby support levels.