


Wedges are a multiple price wave reversal pattern. Wedges form when the waves of an asset move within a narrowing range, angled either up or down. Whereas triangles are formed by the price moving sideways, wedges can make significant progress either up or down.
When the pattern completes, and the price breaks out of wedge, it is usually in the opposite direction the wedge was pointed. This is why it is called a reversal pattern. For example, if a wedge is angled downward—called a "falling wedge"—the price will often break above the top of the pattern and rally. In the case of a wedge angled upwards—a "rising wedge"—the breakout is typically to the downside, indicating lower prices to come.
Examples of Wedges
Draw a wedge by connecting the multiple swing highs with a trendline, and connect the swing lows with another trendline. During a falling wedge, watch for the price to move above the upper trendline. This is a breakout and completes the pattern. Consider taking a long trade, and shy away from short trades.

For a rising wedge, consider a short trade when the price breaks below the lower trendline. Also consider exiting any long positions.

If trading a rising wedge, place a stop loss just above the most recent high within the wedge. When trading a falling wedge, place a stop loss just below the most recent swing low within the wedge.
Price Target
Wedges can be significant turning points. A breakout may see the price run in the breakout direction for long periods of time. Therefore, isn't a long-term price target for wedge. Rather the pattern gives us analytical insight into where the price is headed, and an entry point into what could be a large move.
Following a breakout, the price typically moves at least the height of the wedge (measured at the base where the two trendlines start). For example, if the trendlines start at a swing high of $36 and a swing low of $33, the wedge is $3 high at the base. When the price breaks out, expect at least a $3 move in the breakout price. Therefore, in this case, place targets $3 or more away from the entry.

Trading Considerations
Estimate how far the price could run after a breakout by measuring the height of the pattern, but understand that if a major trend is underway, the price could run a lot further. If you are long during a rising wedge, a downside breakout is a warning sign to get out. If short in a falling wedge, and the price breaks upward, consider exiting.
Wedges can last a long time, narrowing into a smaller or smaller price area. This may result in anticipating when then it will end, or taking trades before the breakout thinking that a breakout will occur soon. It is better to wait until the actual breakout occurs than to speculate on when it will happen.
Analyzing Chart Patterns: Gaps
-
 Trading
Apple Wedge Pattern Could Signal Long-Term Top
Apple has failed a breakout above the three-year rising wedge pattern, opening the door to bearish third quarter price action. -
 Investing
Weatherford International May Drop Despite Uptrend
Weatherford International stock has been rising but may be due to drop soon. -
 Trading
Best Buy Stock Set to Plunge 20%
A break below the key support level in a wedge pattern could imply additional downside for shares of the electronics retailer. -
 Trading
HYG Continues Downward After Breakdown From Rising Wedge
The iShares iBoxx High Yield Corporate Bond ETF has continued to move downward since its breakdown in late January. -
 Trading
Watch for These Stocks to Breakout Soon (ACM, ADBE)
Four stocks close to breaking out of chart patterns, with anticipated entry points and profit targets. -
 Trading
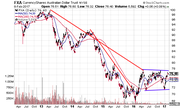
Currency ETFs Near Long-term Breakout Levels
These currency ETFs could be heading into the next wave of the uptrend, but beware of resistance. (FXA,FXC,FXY) -
 Small Business
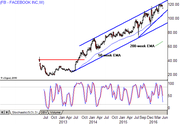
Facebook Headed Lower After Failed Breakout (FB, TWTR)
Facebook could head much lower after failing the April breakout with a Monday's gap through 116. -
 Trading
Palo Alto Networks Stock Breaks Out to All-Time High
Palo Alto stock rallied to an all-time high, underpinned by a wave of cyber-attacks and robot trolling, but is now stuck in a rising wedge pattern. -
 Trading
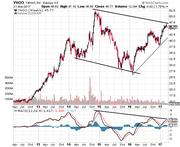
Yahoo!: Uptrend or Due for a Crash?
A major long-term reversal pattern is forming in Yahoo!'s stock. Buying Alphabet on a pullback is likely the better trade. (YHOO,GOOGL) -
 Trading
Alphabet Stock May Complete Long-Term Top
Weak Alphabet price action is flashing warning signs, indicating that the stock may complete a long-term top and enter a new downtrend.