


Chart patterns can be difficult to read given the volatility in price movements. Moving averages can help smooth out these erratic movements by removing day-to-day fluctuations and make trends easier to spot. Since they take the average of past price movements, moving averages are better for accurately reading past price movements rather than predicting future past movements. (To learn more, read the Moving Averages tutorial).
Types of Moving Averages
The three most popular types of moving averages are Simple Moving Averages (SMA), Exponential Moving Averages (EMA), and Linear Weighted Moving Averages. While the calculation of these moving averages differs, they are used in the same way to help assist traders in identifying short-, medium-, and long-term price trends.
Simple Moving Average
The most common type of moving average is the simple moving average, which simply takes the sum of all of the past closing prices over a time period and divides the result by the total number of prices used in the calculation. For example, a 10-day simple moving average takes the last ten closing prices and divides them by ten.
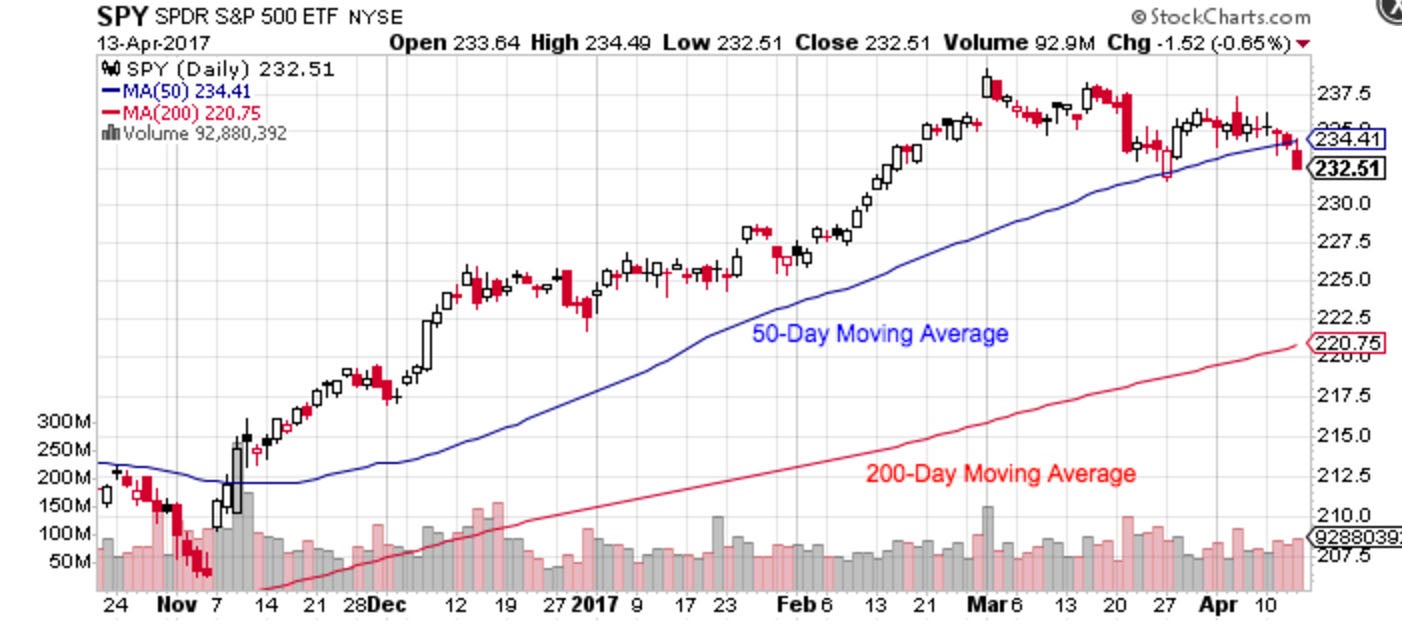
Figure 15 – Simple Moving Averages – Source: StockCharts.com
Figure 15 shows a stock chart with both a 50-day and 200-day moving average. The 50-day moving average is more responsive to price changes than the 200-day moving. In general, traders can increase the responsiveness of a moving average by decreasing the period and smooth out movements by increasing the period.
Critics of the simple moving average see limited value because each point in the data series has the same impact on the result regardless of when it occurred in the sequence. For example, a price jump 199 days ago has just as much of an impact on a 200-day moving average as one day ago. These criticisms sparked traders to identify other types of moving averages designed to solve these problems and create a more accurate measure.
Linear Weighted Average
The linear weighted average is the least common moving average, which takes the sum of all closing prices, multiplies them by the position of the data point, and divides by the number of periods. For example, a five-day linear weighted average will take the current closing price and multiple it by five, yesterday’s closing price and multiple it by four, and so forth, and then divide the total by five. While this helps resolve the problem with the simple moving average, most traders have turned to the next type of moving average as the best option.
Exponential Moving Average
The exponential moving average leverages a more complex calculation to smooth data and place a higher weight on more recent data points. While the calculation is beyond the scope of this tutorial, traders should remember that the EMA is more responsive to new information relative to the simple moving average. This makes it the moving average of choice for many technical traders.
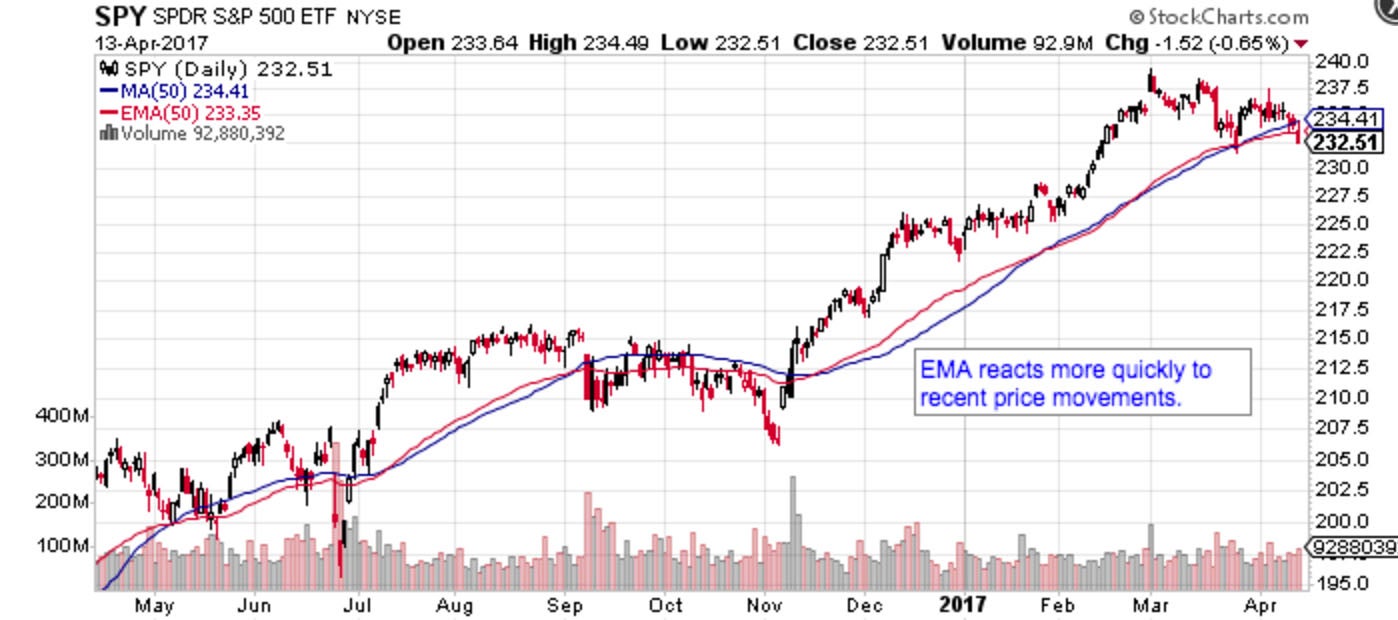
Figure 16 – EMA v. SMA Moving Averages – Source: StockCharts.com
Figure 16 shows how the EMA (red line) reacts more quickly than the SMA (blue line) when sudden price movements occur. For example, the breakout in late-November caused the EMA to move higher more quickly than the SMA even though both are measuring the same 50-day period. The difference may seem slight, but it can dramatically affect returns.
How to Use Moving Averages
Moving averages are helpful for identifying current trends and support or resistance levels, as well as generating actual trading signals.
The slope of the moving average can be used as a gauge of trend strength. In fact, many momentum based indicators (as we will see in the next section) look at the slope of the moving average to determine the strength of a trend. For example, Figure 16 (above) has moving average slopes that clearly show a moderate sideways period between September and October and a significant upswing between December and April.
Many technical analysts often look at multiple moving averages when forming their view of long-term trends. When a short-term moving average is above a long-term moving average, that means that the trend is higher or bullish, and vice versa for short-term moving averages below long-term moving averages.
Moving averages can also be used to identify trend reversals in several ways:
- Price Crossover. The price crossing over the moving average can be a powerful sign of a trend reversal, while the price crossing above the moving average indicates a bullish breakout ahead. Often, traders will use a long-term moving average to measure these crossovers since the price frequently interacts with shorter-term moving averages, which creates too much noise for practical use.
- MA Crossover. Short-term moving averages crossing below long-term moving averages is often the sign of a bearish reversal, while a short-term moving average crossover above a long-term moving average could precede a breakout higher. Longer distances between the moving averages suggest longer term reversals as well. For instance, a 50-day moving average crossover above a 200-day moving average is a stronger signal than a 10-day moving average crossover above a 20-day moving average.

Figure 17 – Crossover and Support Illustrations – Source: StockCharts.com
And finally, moving averages can be used to identify areas of support and resistance. Long-term moving averages, such as the 200-day moving average, are closely watched areas of support and resistance for stocks. A move through a major moving average is often used as a sign from technical traders that a trend is reversing.
Conclusion
Moving averages are a powerful tool for traders analyzing securities. They provide a quick glimpse at the prevailing trend and trend strength, as well as specific trading signals for reversals or breakouts. The most common timeframes used when creating moving averages are the 200, 100, 50, 20, and 10-day moving averages. The 200-day moving average is a good measure for a year timeframe, while shorter moving averages are used for shorter timeframes.
These moving averages help traders smooth out some of the noise found in day-to-day price movements and give them a clearer picture of the trend. In the next section, we will take a look at some of the other techniques used to confirm price and movement patterns.
Technical Analysis: Indicators And Oscillators
-
 Trading
How to Use a Moving Average to Buy Stocks
The moving average (MA) is a simple technical analysis tool that smooths out price data by creating a constantly updated average price. -
 Trading
Simple Versus Exponential Moving Averages
These technical indicators help traders visualize trends by smoothing out price movements, but they are based on different calculations. -
 Trading
The 7 Pitfalls of Moving Averages
While moving averages can be a valuable tool, they are not without risk. -
 Trading
Do Adaptive Moving Averages Lead To Better Results?
These complex indicators can help traders interpret trend changes, but are they too good to be true? -
 Trading
Adjusting Strategies to Moving Average Slopes
Managing interrelationships between price, moving averages and slope can shift the reward:risk equation in your favor, learn more in this article. -
 Trading
Moving Averages
Discover one of the most reliable indicators in technical analysis and learn how to incorporate it into your trading routine. -
 Investing
Gravity MIA After Seven Straight Up Weeks for S&P500
Three quarters of S&P500 stocks are above their 50-day moving averages. Should investors be worried? -
 Trading
3 Charts That Suggest It's Time to Sell Social Media Stocks
Bearish price action on charts of key assets across the social media sector suggest that the long-term downtrend could just be getting started.