


There are millions of different investors transacting billions of dollars’ worth of securities each day and it’s nearly impossible to decipher everyone’s motivations. Chart patterns look at the big picture and help to identify trading signals – or signs of future price movements.
One of the three assumptions discussed earlier in this tutorial was that history repeats itself. The theory behind chart patterns is based on this assumption – that certain patterns consistently reappear and tend to produce the same outcomes. For example, as market sentiment shifts from optimism to fear, a certain pattern might emerge before traders and investors start selling and send the stock price lower.
Chart patterns have an established definition and criteria, but there are no patterns that tell you with 100% certainty where a security is headed. After all, the richest man in the world would be a trader in that case rather than an investor! The process of identifying chart patterns based on these criteria can be subjective in nature, which is why charting is often seen as more of an art than a science. (For more insight, see Is finance an art or science?).
The two most popular chart patterns are reversals and continuations. A reversal pattern signals that a prior trend will reverse upon completion of the pattern, while a continuation pattern signals that the trend will continue once the pattern is complete. These patterns can be found across any timeframe. In this section, we will review some of the more popular chart patterns. (To learn more, check out Continuation Patterns – Part 1, Part 2, Part 3, and Part 4).
[ Chart patterns are an integral part of technical analysis, but successful traders combine these techniques with technical indicators and other forms of technical analysis to maximize their odds of success. If you're interested in learning about these topics, Investopedia's Technical Analysis Course provides an in-depth look into basic and advanced technical analysis, chart patterns, and technical indicators, with over five hours of on-demand video, exercises, and interactive content. ]
Head and Shoulders
The Head and Shoulders is a reversal chart pattern that indicates a likely reversal of the trend once it’s completed. A Head and Shoulder Top is characterized by three peaks with the middle peak being the highest peak (head) and the two others being lower and roughly equal (shoulders). The lows between these peaks are connected with a trend line (neckline) that represents the key support level to watch for a breakdown and trend reversal. A Head and Shoulder Bottom – or Inverse Head and Shoulders – is simply the inverse of the Head and Shoulders Top with the neckline being a resistance level to watch for a breakout higher.
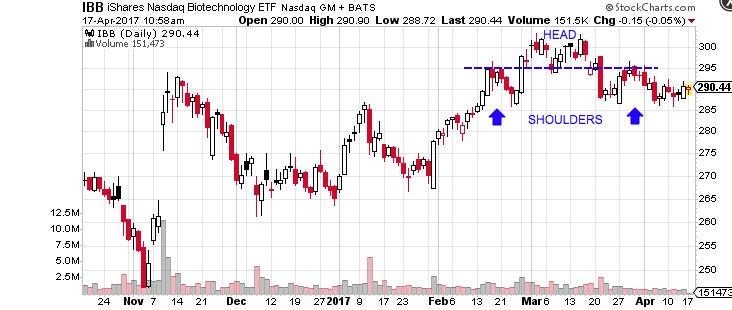
Figure 22 – Head and Shoulders – Source: StockCharts.com
Cup and Handle
The Cup and Handle is a bullish continuation pattern where an upward trend has paused, but will continue when the pattern is confirmed. The ‘cup’ portion of the pattern should be a “U” shape that resembles the rounding of a bowl rather than a “V” shape with equal highs on both sides of the cup. The ‘handle’ forms on the right side of the cup in the form of a short pullback that resembles a flag or pennant chart pattern. Once the handle is complete, the stock may breakout to new highs and resume its trend higher.
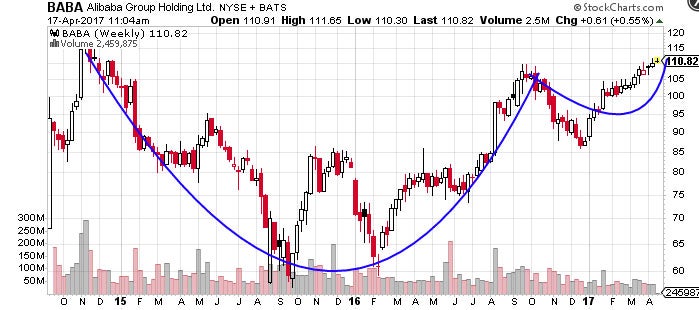
Figure 23 – Cup and Handle Example – Source: StockCharts.com
Double Tops and Bottoms
The Double Top or Double Bottom pattern are both easy to recognize and one of the most reliable chart patterns, making them a favorite for many technically-orientated traders. The pattern is formed after a sustained trend when a price tests the same support or resistance level twice without a breakthrough. The pattern signals the start of a trend reversal over the intermediate- or long-term. (For more in-depth reading, see The Memory of Price and Price Patterns – Part 4).
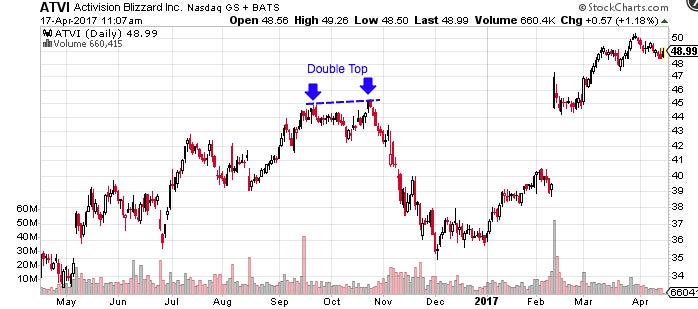
Figure 24 – Double Top Example – Source: StockCharts.com
Triangles
Triangles are among the most popular chart patterns used in technical analysis since they occur frequently compared to other patterns. The three most common types of triangles are symmetrical triangles, ascending triangles, and descending triangles. These chart patterns can last anywhere from a couple weeks to several months.
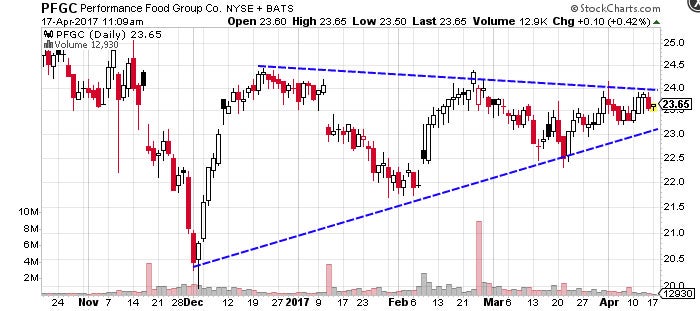
Figure 25 – Symmetrical Triangle Example – Source: StockCharts.com
Symmetrical triangles occur when two trend lines converge toward each other and signal only that a breakout is likely to occur – not the direction. Ascending triangles are characterized by a flat upper trend line and a rising lower trend line and suggest a breakout higher is likely, while descending triangles have a flat lower trend line and a descending upper trend line that suggests a breakdown is likely to occur. The magnitude of the breakouts or breakdowns is typically the same as the height of the left vertical side of the triangle.
Flags & Pennants
Flags and Pennants are short-term continuation patterns that represent a consolidation following a sharp price movement before a continuation of the prevailing trend. Flag patterns are characterized by a small rectangular pattern that slopes against the prevailing trend, while pennants are small symmetrical triangles that look very similar.
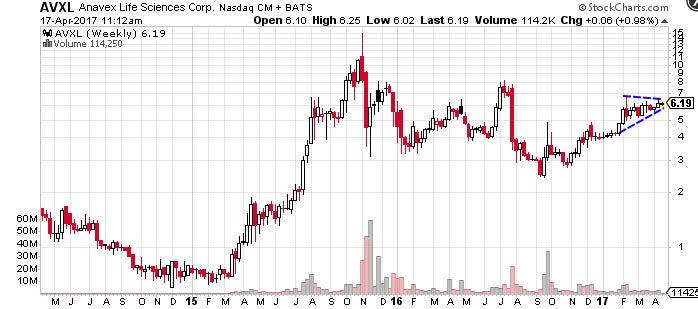
Figure 26 – Pennant Example – Source: StockCharts.com
The short-term price target for a flag or pennant pattern is simply the length of the ‘flagpole’ or the left vertical side of the pattern applied to the point of the breakout, as with the triangle patterns. These patterns typically last no longer than a few weeks, since they would then be classified as rectangle patterns or symmetrical triangle patterns.
Wedges
The Wedge pattern is a reversal or, less commonly, continuation pattern that’s similar to the symmetrical triangle except that it slants upward or downward. Rising wedges are bearish chart patterns that occur when trend is moving higher and the prices are converging and the prevailing trend is losing momentum. Falling wedges are bullish chart patterns that occur when the trend is moving lower and prices are converging, which signifies that the bearish trend is losing momentum and a reversal is likely.
The wedge pattern can be very difficult to identify and trade, which means it’s important to look for confirmations in other technical indicators, as we’ll learn about in the next section. For example, most traders watch for a diverging relative strength index or moving average convergence-divergence trend line that confirms a reversal is likely to occur.
Gaps
Gaps occur when there is empty space between two trading periods that’s caused by a significant increase or decrease in price. For example, a stock might close at $5.00 and open at $7.00 after positive earnings or other news. There are three main types of gaps: Breakaway gaps, runaway gaps, and exhaustion gaps. Breakaway gaps form at the start of a trend, runaway gaps form during the middle of a trend, and exhaustion gaps for near the end of the trend. (For more insight, read Playing the Gap).
Triple Tops & Bottoms
Triple Tops and Triple Bottoms are reversal patterns that aren’t as prevalent as Head and Shoulders or Double Tops or Double Bottoms. But, they act in a similar fashion and can be a powerful trading signal for a trend reversal. The patterns are formed when a price tests the same support or resistance level three times and is unable to break through.

Figure 27 – Triple Bottom Example – Source: StockCharts.com
Rounding Bottom
The Rounding Bottom – or Saucer Bottom – is a long-term reversal pattern that signals a shift from a downtrend to an uptrend and lasts anywhere from several months to several years.
The chart patterns looks similar to a Cup and Handle pattern but without the handle. The long-term nature of the pattern and lack of a confirmation trigger – such as the handle – makes it a difficult pattern to trade.
Conclusion
Chart patterns are a valuable part of technical analysis – even if they are more art than science. Many traders use them to identify potential trades that they can confirm using other forms of technical analysis to maximize their odds of success. You should now be able to recognize some of these chart patterns as we move on to other forms of technical analysis.
Technical Analysis: Moving Averages
-
 Trading
Continuation Patterns: An Introduction
Learn the most common varieties of continuation patterns and how they work in market analysis. -
 Trading
Technical Analysis: Triple Tops and Bottoms
Triple and double tops and bottoms may be tough to spot but can be powerful patterns. -
 Trading
Introduction to Technical Analysis Price Patterns
How to recognize price patterns that are key to technical analysis. -
 Trading
Stock Chart Patterns to Keep an Eye On
Some of these stocks are exhibiting big chart patterns, so a breakout is likely to be significant. -
 Trading
Most Commonly Used Forex Chart Patterns
Greatly improve your forex trading by learning these commonly used forex chart patterns that provide entries, stops and profit targets. -
 Trading
Inverse Head and Shoulders Patterns Breaking Out
Watch for higher prices if these stocks complete inverse head and shoulders patterns (a bottoming pattern). -
 Trading
Advanced Candlestick Patterns
Learn how to identify and trade the island reversal, kicker, hook reversal and three gap advanced candlestick patterns.