


The only metric that we’ve discussed so far in this tutorial is the price, but there are other non-price factors that are equally as important – including volume.
What is Volume?
Volume is simply the number of shares or contracts that trade over a given period – usually a day. Often times, volume is expressed as a bar chart directly below the price chart with the bars height illustrating how many shares have traded per period. Volume charts can also be analyzed to show trends of increasing or decreasing volume over time. (For further reading, see Price Patterns – Part 3, Gauging Support and Resistance with Price by Volume).
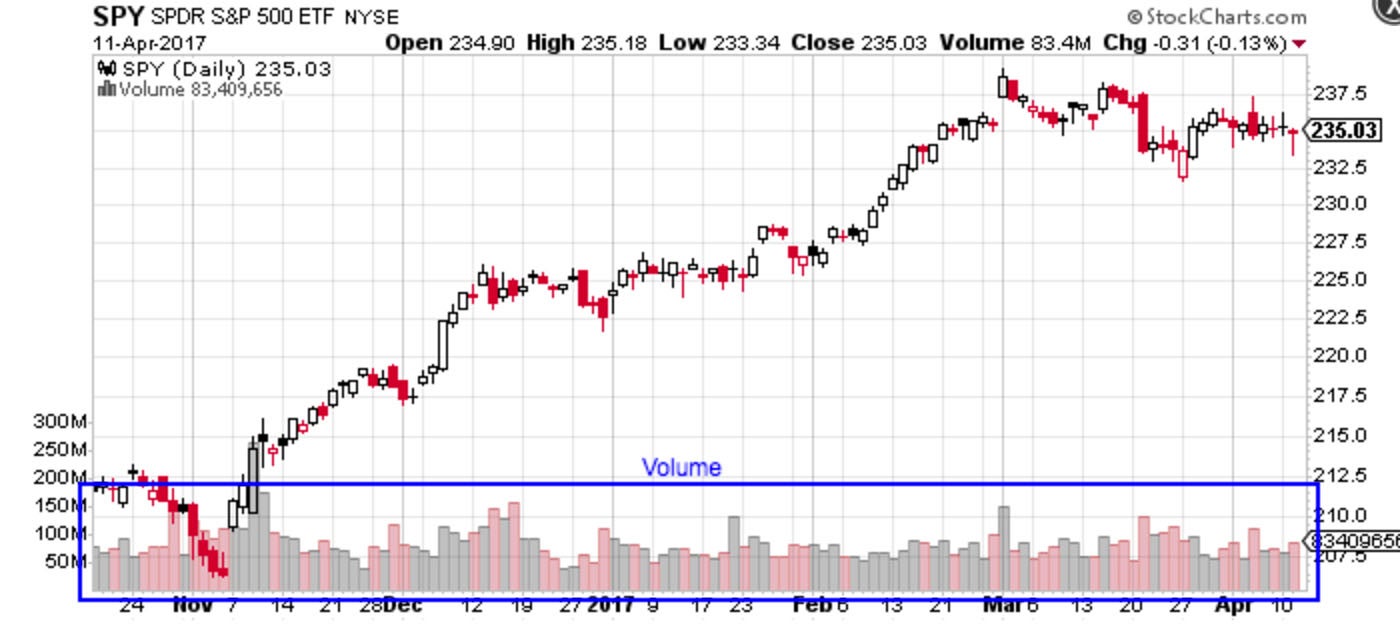
Figure 8 – Volume on Chart – Source: StockCharts.com
Why Volume is Important?
Volume is used by technical analysts to confirm trends and chart patterns. The strength of any given price movement is measured primarily by the volume. In fact, a 50% rise in a stock price may not be all that relevant at all if it occurs on very little volume – just look at penny stocks.
[ Volume is extremely important as a confirmation for technical indicators, but you'll still need to know about other technical indicators. Investopedia's Technical Analysis Course provides a comprehensive introduction to the subject with over five hours of on-demand video, exercises, and interactive content covering both basic and advanced techniques. ]
For example, suppose that a stock jumps 5% in one trading day after being in a long-term downtrend. Is this a reversal of the long-term trend? The answer depends on whether there was a substantial amount of volume behind the move. If the volume was below average, the move was likely a fluke and the downtrend is likely to continue. On the other hand, if the volume was significantly higher than average, then it could be the start of a reversal. (To read more, check out Trading Volume – Crowd Psychology).
In addition to single day moves, the trend in volume over time can be related to price trends to determine if a stock is gaining or losing momentum. An example might be a stock that has been trending higher with declining volume, which suggests that the rally may be losing momentum. In that case, traders may want to be on the lookout for a reversal and perhaps reduce or sell their long positions in preparation. This is known as divergence. (For additional insight, read Divergences, Momentum, and Rate of Change).
Volume and Chart Patterns
Volume is invaluable when confirming chart patterns, such as head and shoulders, triangles, flags, and other patterns. These chart patterns will be discussed in greater detail later on, but for now, know that chart patterns try to predict pivotal moments – like reversals. If volume isn’t present alongside these chart patterns, then the resulting trading signal isn’t as reliable.
Volume Precedes Price
A final important concept to understand is that price is preceded by volume. Technical analysts closely watch volume to see when reversals are likely to occur, which means that volume changes can be a precursor to price changes. If volume is decreasing in an uptrend, it could signal that the uptrend is coming to a close and a reversal may be likely.
Now that we have a better understanding of some of the most important core elements of technical analysis, we will move on to charts, which help identify trading opportunities in price movements.
Technical Analysis: What Is A Chart?
-
 Trading
Essential Strategies for Trading Volume
Looking to trade using volume? Have a look at these essential tips. -
 Trading
Use Market Volume Data to Determine a Bottom
Market bottoms often carve out classic volume patterns that let observant traders make fast and accurate calls. -
 Trading
What's In Store For These Stocks With Unusually High Volume?
For these four stocks with recent usually high volume, the overall technical picture will be used to help gauge in which direction the next tradable moves will be. -
 Investing
The Importance of Trade Volume
Stock volume is easy to calculate but understanding its importance is a little more involved. Take the time, because it adds value to your investing decision. -
 Trading
Technical Analysis: Triple Tops and Bottoms
Triple and double tops and bottoms may be tough to spot but can be powerful patterns.