


A company’s income statement tells you how much money it has taken in and how much it has paid out over a year or a quarter. Looking at the annual income statement rather than a quarterly statement will give you a better idea of the company’s overall position since many companies experience fluctuations in sales volume during the year.
Revenue
The first item on the income statement tells you how much money the company received from selling its products and/or services to its customers. This figure may be labeled “revenues,” “net sales,” “net operating revenues” or something similar. By comparing the current year’s figure to previous years’ figures, you can see if the company’s sales are improving over time. Increasing sales also indicate that the company is growing. Amazon reported total net sales of $135,987 million in 2016, for example, and this represented a significant increase over the $107,006 million it reported in 2015 and the $88,988 million it reported in 2014. (Source: 2016 Annual Report, p. 37) (Though Amazon is often considered a growth stock, not a value stock, we’re using it as an example here because everyone is familiar with the company and its financial statements are easy to read.)
Consolidated Statements of Operations from Amazon’s 2016 Annual Report
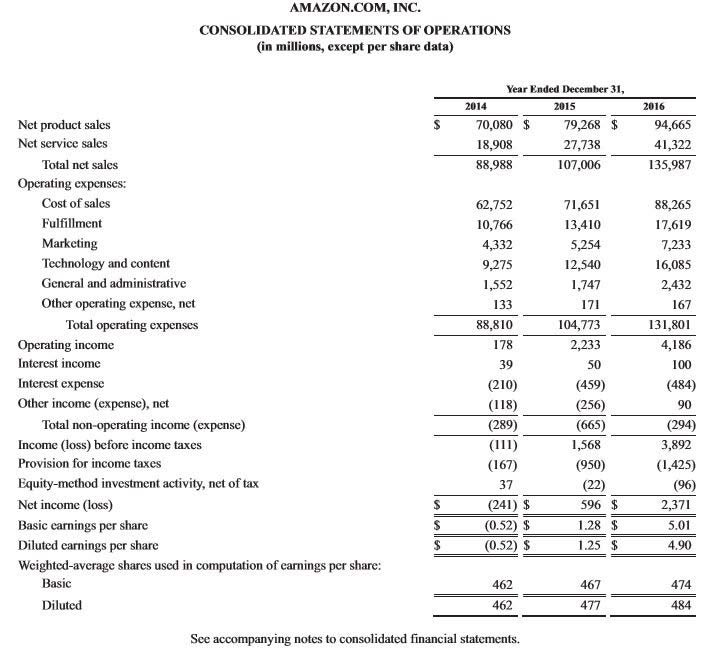
Source: Amazon 2016 Annual Report, p. 37.
Expenses
Next, the income statement gets into the company’s expenses. This second line might be called “cost of products sold,” “cost of goods sold,” “cost of sales” (in Amazon’s case), “cost of services” or some variation thereof. Subtracting cost of revenue from actual revenue generated produces gross profit. In other words, how much revenue does the company actually earn after subtracting the cost to produce what it sells? Amazon reported cost of sales at $88,265 million for 2016. Subtracting this figure from total net sales of $135,987 yields a gross profit of $47,722 million.
There are more expenses to account for, however, and gross profits must be high enough to cover those expenses and leave a net profit. Companies have selling, general and administrative expenses (SG&A). Sometimes companies call these “selling, marketing and administrative expenses,” or they might break the category down and list marketing expenses separately from general and administrative expenses. Some companies, like biotech companies, have research and development expenses in addition to SG&A. Amortization and depreciation are also considered operating expenses. Look at the company’s expenses over time. If expenses are increasing, that isn’t necessarily a bad thing if revenues are also increasing, and at a higher rate. However, you don’t want to see expenses increasing over time as a percentage of revenues; you want to see them holding steady or decreasing as a percentage of revenues.
Income
Subtracting total operating expenses from total net sales gives you the company’s operating income. Amazon’s total operating expenses for 2016 were $131,801 million and included fulfillment, marketing, technology and content, general and administrative, and other. Subtracting $131,801 million in operating expenses from $135,987 million in total net sales left Amazon with $4,186 million in operating income.
After subtracting interest expenses and income taxes from operating income — in addition to making any other company-specific adjustments — you get the company’s net income, also called net earnings or net loss. This number is the bottom line. For 2016, Amazon’s net income or bottom line was $2,371 million.
Earnings Per Share
Finally, the last lines of the income statement present the company’s basic earnings per share and diluted earnings per share. Basic EPS divides net income by number of shares outstanding. Some companies describe shares outstanding as “basic average shares outstanding” or “shares used in calculation of earnings per share.” Amazon’s basic weighted average shares outstanding for 2016 amounted to 474 million. If we divide $2,371 million of net earnings by 474 million shares outstanding, we get basic earnings per share of $5.01. Thankfully, we don’t actually have to do the math because most companies do it for us in the financial reports. Analysts and investors are always looking for earnings per share growth.
The income statement also presents figures for diluted earnings per share. Most companies issue convertible securities such as stock options, convertible bonds, preferred stock and warrants. Diluted EPS represents earnings per share if all these financial instruments were converted to shares. If convertibles are turned into shares, there will be more total shares outstanding, and each stockholder will own a smaller percentage of the company. Owning a smaller percentage of the company means owning a smaller percentage of the profits. Diluted EPS will thus be lower than basic EPS, but value investors want this difference to be small.
The income statement also shows how the number of shares outstanding has changed over time. Amazon’s 2016 10-K, for example, shows that its basic shares were 462 million in 2014, 477 million in 2015, and 484 million in 2016. Although growth companies like Amazon will typically increase the number of outstanding shares annually, value stocks will have a decreasing number of shares. That decreasing number reflects the existence of share buyback programs, which indicate management’s confidence in the company’s future performance. It also means that each share of the company’s stock is entitled to a higher percentage of earnings. On the other hand, if shares outstanding are increasing, it could mean that the company is handing out lots of stock options, which will dilute investors’ earnings, or that the company is raising more money through new stock offerings.
Calculating Profitability
Now that we understand what the numbers on the income statement mean, we can use them to calculate the most basic measures of profitability. Profit margin can be a more helpful indicator of a company’s performance than net sales or net revenue because it takes costs into account. There are two types of profit margin: net and gross. Calculated as a percentage, net profit margin divides net profit by sales, while gross profit margin divides gross profit by sales. Remember, the numbers you need for these calculations are located at bottom and top of the income statement. For 2016, Amazon’s gross profit margin was 47,722 / 135,987 = 35.09%; its net profit margin was 2,371 / 135,987 = 1.7%. (Learn more in A Look At Corporate Profit Margins and What is considered a healthy operating profit margin?)
A low profit margin can indicate that a company’s costs are too high or that the market won’t support a high enough price for its products and services. However, there is not an absolute number that is considered a good profit margin; what’s considered good depends on the company’s industry. Comparing a company’s profit margins to those of its competitors can indicate whether the company has a good profit margin and how the company may perform long term. Comparing a company’s most recent year’s profit margin to its previous year’s profit margins tells you how the company is performing over time. Value investors want to see a company’s profit margin be higher than that of its competitors, and they want the companies they invest in to have consistent or increasing profit margins over time.
Remember, value investors are long-term investors, so it’s important that when you look at a company’s income statement, you see long-term profitability.
With all the information you have learned how to gather in this chapter and the previous one, you can now compare any stock you’re interested in to others like it. Value investors find it especially helpful to compare stocks they’re considering to those of similar companies that have recently been acquired. The price a stock sells for in an acquisition often accurately reflects the company’s true value since acquisitions are transacted by well-informed investors. (These deals can make or break investors’ returns. Find out how to tell the difference in Analyzing An Acquisition Announcement.)
No matter how much research you do, though, value investing, like all types of investing, is not foolproof. In the next section, we’ll discuss some of the risks and how to manage them.
Value Investing: Managing The Risks In Value Investing
-
 Investing
Profitability Indicator Ratios
Learn about profit margin analysis, effective tax rate, return on assets, return on equity and return on capital employed. -
 Investing
Gross, Operating and Net Profit Margins
A company’s income statement includes the company’s gross, operating and net profits. -
 Investing
Find Investment Quality In The Income Statement
Use these key attributes to uncover top-level investments. -
 Managing Wealth
What’s a Good Profit Margin for a New Business?
Surprisingly, the younger your company is, the better its numbers may look when it comes to your profit margin. -
 Investing
How to Analyze Netflix's Income Statement
Learn how to read Netflix's income statement and use it to evaluate the company's current financial condition. -
 Investing
The 5 Types Of Earnings Per Share
Learn the five varieties of Earnings Per Share (EPS) and what each represents can help an investor determine whether a company is a good value, or not. -
 Investing
Investment Valuation Ratios
Learn about per share data, price/book value ratio, price/cash flow ratio, price/earnings ratio, price/sales ratio, dividend yield and the enterprise multiple.