


Value investors can’t get all the information they need about a company from a casual glance at a stock quote or from reading stock market commentary. In this section, we’ll tell you where to find that information and what to look for.
Financial Reports
Financial reports present a company’s annual and quarterly performance results. The annual report is SEC form 10-K and the quarterly report is SEC form 10-Q. Companies are required to file these reports with the Securities and Exchange Commission (SEC). You can find them at the SEC website or at the company’s corporate or investor relations website.
You can learn a lot from a company’s annual report. It will explain what products and/or services the company sells and give you an idea of how the company sees itself. For example, many people first think of merchandise and Prime shipping when they think of Amazon.com.
However, Amazon’s 2016 annual report says, “We seek to be Earth’s most customer-centric company. We are guided by four principles: customer obsession rather than competitor focus, passion for invention, commitment to operational excellence, and long-term thinking. In each of our segments, we serve our primary customer sets, consisting of consumers, sellers, developers, enterprises, and content creators. In addition, we provide services, such as advertising services and co-branded credit card agreements.” (Source: 2016 annual report, p. 3)
This statement tells investors that the company has a much broader focus than the products and services it sells. A company’s financial reports will also describe its recent accomplishments, leadership changes, risk factors, intellectual property, any regulatory changes that affect the company and more.
If you’re interested in investing in a company but you’re not sure you understand its business model, try reading the annual report — it might be eye-opening. For example, you might not think of yourself as someone who would invest in a pharmaceutical company, but when you read its annual report and learn about what its major drugs are, why people need them and how they work, you might discover that you understand more than you expected to. However, if you’re still lost after doing this research, you should probably pass on the stock.
Financial reports also provide the financial data that investors want to analyze, such as revenue, operating expenses, net income, total assets, total debt and more. Financial reports also make it easy to compare these numbers across time by providing historical data along with current data. For example, a look at Amazon’s 2016 statement of operations shows that Amazon’s net sales have increased every year for the last five years, from $61,093 million in 2012 to $135,987 million in 2016. (Source: 2016 annual report, p. 17) You can also look up older annual reports. Analyzing historical will help you evaluate growth prospects and create forecasts.
Select Consolidated Financial Data from Amazon’s 2016 Annual Report
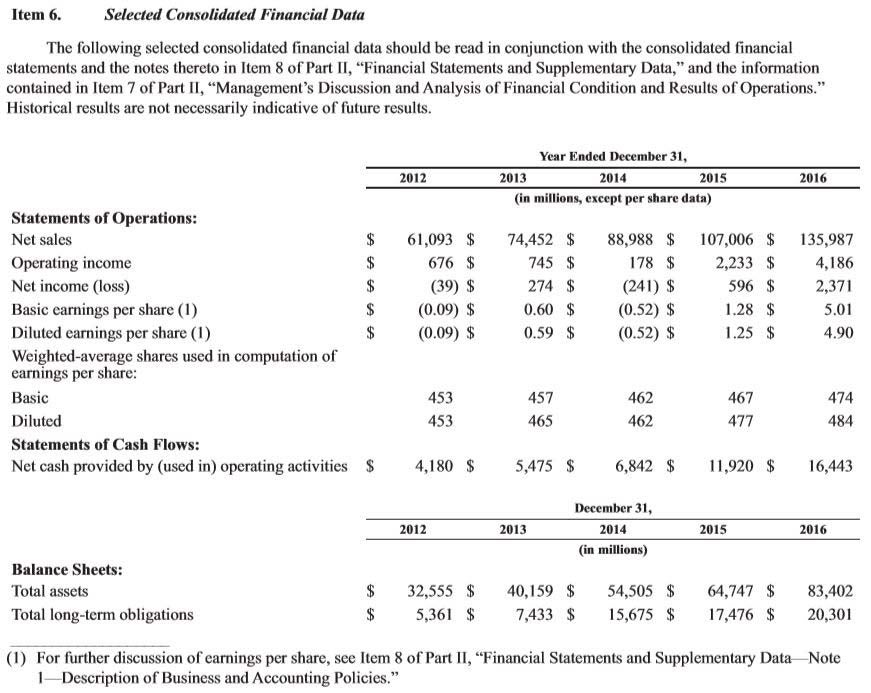
Source: Amazon 2016 Annual Report, p. 17.
Financial reports can also tell you a lot about the company’s weaknesses. Amazon’s 2016 annual report says, for example, “Our International Operations Expose Us to a Number of Risks,” “If We Do Not Successfully Optimize and Operate Our Fulfillment Network and Data Centers, Our Business Could Be Harmed” and “The Seasonality of Our Business Places Increased Strain on Our Operations.” (Source: 2016 annual report, pp. 8–9) As a potential investor, you will want to think about how much of a threat these risks are to your likelihood of earning a profit.
An essential component of any financial report is the company’s financial statements. We’ll examine two, the balance sheet and the income statement, that contain many of the numbers you’ll need for your value investment analysis.
The Balance Sheet
A company’s balance sheet provides a big picture of the company’s financial condition. The balance sheet consists of two sections, one listing the company’s assets and another listing its liabilities and equity.
The assets section is broken down into a company’s cash and cash equivalents; investments; trade receivables or accounts receivable; inventories; deferred tax assets; intangible assets; goodwill; property, plant and equipment; and other assets. These subcategories won’t be identical for every company you examine because different companies have different types of assets.
The liabilities section lists the company’s accounts payable, accrued liabilities, convertible notes, long-term debt, other noncurrent liabilities, and any other outstanding debts that the company may have. The shareholders’ equity section reflects how much money is invested into the company in addition to cumulative retained earnings. Again, these subcategories won’t be identical for every company you examine because different companies have different types of liabilities. For example, an insurance company might list “unearned premiums” as a liability, but a food service company would not.
Consolidated Balance Sheets from Amazon’s 2016 Annual Report
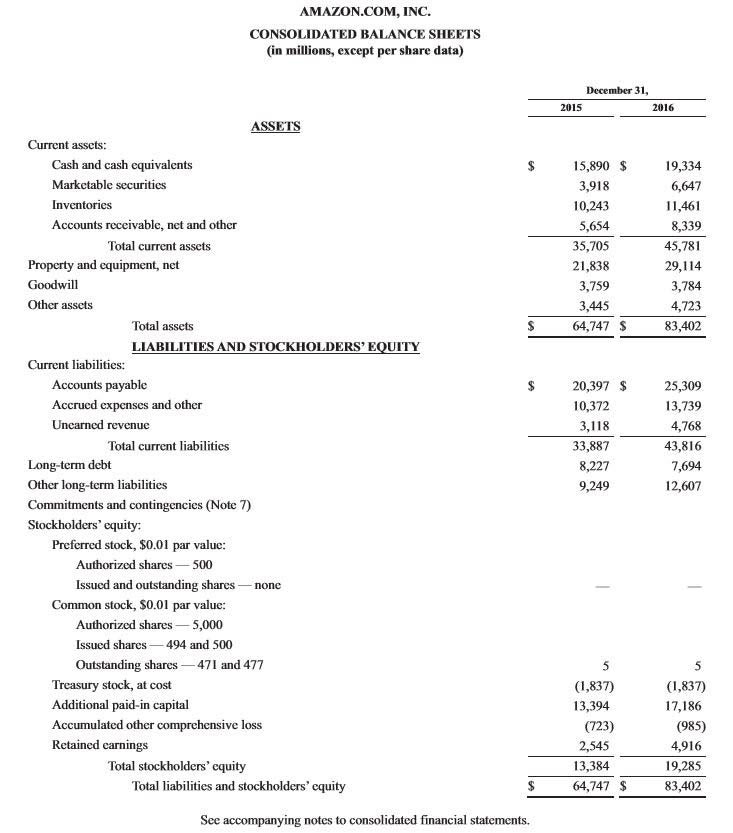
Source: Amazon 2016 Annual Report, p. 39.
One important ratio that value investors like to calculate using balance sheet data is called the current ratio. The current ratio compares the company’s total current assets to its total current liabilities. Current assets will be utilized within a year and current liabilities must be covered within the same time frame.
The higher the ratio, the better, but value investors like to see a current ratio of at least 2 to 1, meaning that the company has at least twice as many current assets as current liabilities. The current ratio indicates how easily a company can cover its current obligations and reveals the firm’s general liquidity position. Comparing a company’s current ratio for the most recent year to that of previous years and to that of similar companies for the same years will help you put this number into perspective.
For some calculations, you can let someone else do the math for you. Yahoo! Finance, for example, provides the current ratio and many other important metrics under a category called “Key Statistics” when you look up a company’s ticker symbol.
While you’re at it, you can also calculate net current assets per share. To get net current assets (also called working capital or current capital), you subtract current liabilities from current assets. Divide the result by the number of shares outstanding and you get net current assets per share. (You can find a company’s shares outstanding via the company’s income statement.) Give greater consideration to companies where the stock price is no more than 67% of its net current asset value per share.
The balance sheet also provides a snapshot of a company’s long-term finances. Long-term assets may be lumped together under a term like “fixed assets“ or “property, plant and equipment.” Included in these categories are assets such as the real estate and factories the company owns. “Intangible assets” is also a long-term asset; it attempts to measure the value of the company’s intellectual property holdings (copyrights, trademarks and patents). Long-term liabilities are a company’s financial obligations whose maturity is longer than one year, including real estate leases and bond issues.
Another important number to get from the balance sheet is the company’s debt-to-assets ratio. To get this number, divide total liabilities by total assets. (Note that the term “debt” is used very loosely in this ratio to include all of a company’s liabilities, not just its long term debt.) Benjamin Graham avoided companies whose debt exceeded 50% of assets. The lower the company’s debt ratio, the better. (Read The Debt Ratio to learn more.)
Book value per share and price-to-book ratio are also meaningful. Book value is the company’s net worth: its assets minus its liabilities. Calculate book value per share by dividing the company’s net worth by the number of shares outstanding. Value investors are interested in companies whose stock price is below book value per share. If a company has a net worth of $10 million and it has 500,000 shares outstanding, its book value per share is $10,000,000 / 500,000, or $20. If the stock is trading for $15, it may be worth researching further. Comparing the $15 stock price to the $20 book value gives us the price-to-book ratio of $15/$20 = 0.75.
These aren’t the only financial ratios you can calculate using balance sheet figures, but they are a few of the most basic ones. (For more, see Reading The Balance Sheet and our Financial Ratio Tutorial.)
If a company’s balance sheet doesn’t check out or if you can’t understand it, cross the stock off your list and move on.
Next, let’s look at what you can learn from income statements.
Value Investing: Finding Value In Income Statements
-
 Investing
Reading the Balance Sheet
Learn about the components of a company balance sheet - aka the statement of financial position - and how it relates to other financial statements. -
 Investing
Breaking Down The Balance Sheet
Knowing what the company's financial statements mean will help you to analyze your investments. -
 Investing
How to Analyze a Company's Financial Position
Find out how to calculate important ratios and compare them to market value. Using company financial analysis, we can analyze a firm's financial position. -
 Investing
Reviewing Liabilities On The Balance Sheet
As an experienced or new analyst, liabilities tell a deep story of how a company finances, plans and accounts for money it will need to pay at a future date. -
 Investing
Liquidity Measurement Ratios
Learn about the current ratio, quick ratio, cash ratio and cash conversion cycle. -
 Personal Finance
How To Improve Net Worth By Decreasing Liabilities
Here's an analysis of how to adjust liabilities and assets to improve net worth. -
 Investing
6 Basic Financial Ratios And What They Reveal
These formulas can help you pick better stocks for your portfolio once you learn how to use them.