


|
ETFs tracking stock indexes figure prominently among the leading ETFs measured by assets under management and trading volume. Stock index ETFs allows investors to get exposure to the broader market with the same ease as buying a single stock.
Stock index ETFs can also be used for hedging market exposure. For example, long positions in the stock market could be hedged by short selling a stock index ETF or by buying an inverse stock index ETF. The high levels of liquidity and volatility along with the availability of low commission rates to enter and exit trades have also made them popular among day traders.
Major factors that influence the movement of stock index ETFs include earnings reports, economic data and geopolitical news. Stock index ETFs are designed to closely track their underlying indexes and, consequently, their price movements mirror that of the index they follow. (For related reading, see: Index Investing.)
SPDR S&P 500 ETF – SPY
SPDR S&P 500 ETF (SPY) tracks the S&P 500, an index based on the market capitalizations of 500 large companies with common stock listed on national stock exchanges. Broader than the Dow Jones Industrial Average, which includes only 30 companies, the S&P 500 is a widely used benchmark of the U.S. stock market. An increase or decrease in the S&P 500 Index is matched by a commensurate upward or downward move in the SPDR S&P 500 ETF.
Launched by State Street Global Advisors in 1993, SPDR is the world’s largest ETF, with total assets of $267.97 billion as of Feb. 22, 2018. With a massive average daily volume of over 75 million shares, it’s also the most liquid ETF in the world. It has an expense ratio of 0.09%.
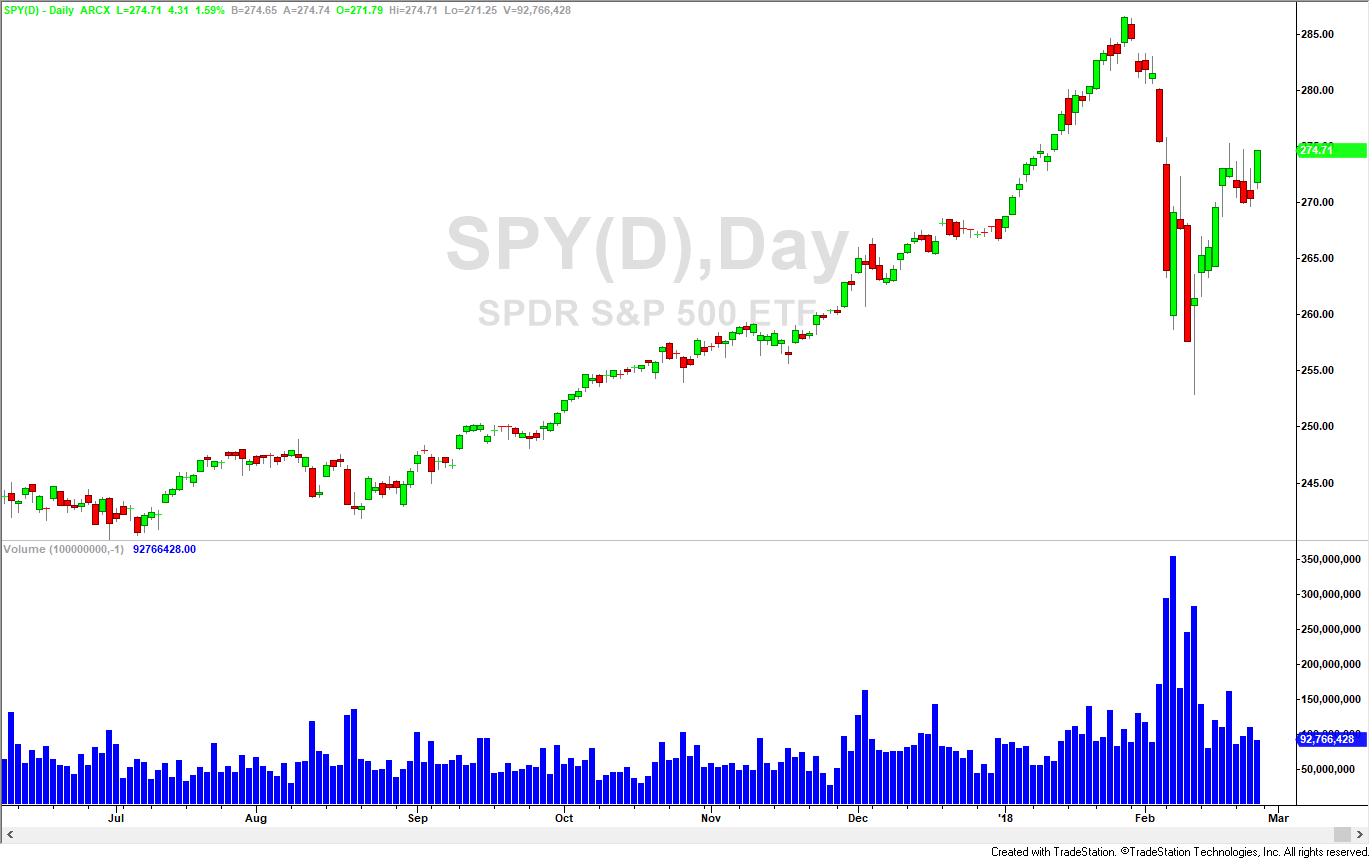
A daily chart of SPY shows the ETF’s impressive daily volume. Chart created with TradeStation.
iShares Core S&P 500 ETF – IVV
Like SPY, iShares Core S&P 500 ETF (IVV) is another fund that offers exposure to the S&P 500. In theory, these (and other) S&P 500-tracking ETFs should be the same; however, there are small differences in their structures. SPY is a unit investment trust – so it has certain limitations, such as not being able to lend out underlying shares to other firms (it also has a higher expense ratio). IVV, on the other hand, is set up as a true ETF, so it can use derivatives, portfolio lending and other strategies.
Launched in 2000, the fund has $155.61 billion in total assets as of Feb. 23, 2018, an average daily volume of 3.8 million and a low expense ratio of 0.04%.
Vanguard Total Stock Market ETF – VTI
The Vanguard Total Stock Market ETF (VTI) caters to investors looking for the broadest exposure to the U.S. stock market. The fund provides a simple and inexpensive way to diversify a large cap portfolio. VTI tracks the performance of the CRSP US Total Market Index, a benchmark that measures the investment return of the overall U.S. stock market. The index includes large-, mid- and small-cap stocks regularly traded on the New York Stock Exchange and Nasdaq.
Launched in 2001, the fund has $93.59 billion in assets under management as of Feb. 22, 2018. VTI has an average daily volume of 2.4 million and a very low expense ratio of 0.04%.
Vanguard S&P 500 ETF – VOO
Part of Vanguard’s well-respected portfolio of funds, Vanguard S&P 500 ETF (VOO) is the newest of the top S&P 500-tracking ETFs. Like SPY and IVV, VOO boasts low costs and high liquidity, while offering the large-cap exposure you would expect from a S&P 500 benchmark fund. Unlike SPY, VOO reinvests its interim cash.
VOO launched in 2010. The fund has $89.92 billion in total assets as of Feb. 23, 2018, an average daily volume of 2.2 million and a low expense ratio of 0.04%. (See also: Top 3 ETFs to Track the S&P 500 as of December 2017.)
PowerShares QQQ – QQQ
PowerShares QQQ ETF (QQQ) – previously known as the QQQQ – is a widely held and traded ETF that tracks the Nasdaq 100 Index. The technology-heavy Nasdaq 100 Index includes 100 of the largest domestic and international nonfinancial companies listed on the Nasdaq by market capitalization. As a result, QQQ is heavily weighted toward large-cap tech firms.
Launched in 1999 by Invesco PowerShares Capital Management, QQQ has total assets of $59.29 billion as of Feb. 22, 2018 and an average daily volume of nearly 32 million. The fund has an expense ratio of 0.20%. (For more, see: What is the QQQ ETF?)
iShares Russell 2000 – IWM
The iShares Russell 2000 ETF (IWM) tracks the broad-based Russell 2000 Index and provides investors with access to the small-cap segment of the U.S. equity market. The Russell 2000 Index is made up of the smallest 2000 companies in the Russell 3000 Index. When the Russell 2000 Index moves up or down, an equivalent move is seen in the iShares Russell 2000 Index ETF. Small-cap stocks offer large growth potential but come with a higher degree of risk. Historically, small-cap stocks have performed well during rising interest rate environments.
Launched in May of 2000, the fund has total assets of $40.16 billion as of Feb. 22, 2018. Another highly liquid ETF, IWM has an average daily volume of 25.4 million and relatively high expense ratio of 0.20%.
SPDR Dow Jones Industrial Average – DIA
SPDR Dow Jones Industrial Average ETF (DIA) shares are sometimes referred to as "diamonds," a wordplay on the ticker symbol. The fund is managed by State Street Global Advisors and tracks the Dow Jones Industrial Average, a price-weighted index of 30 blue-chip U.S. stocks. The Dow Jones Industrial Average is one of the oldest and most closely followed stock market benchmarks in the world.
Launched in 1998, the fund has net assets under management of $22.61 billion as of Feb. 22, 2018, an average daily volume of 3.4 million contracts traded and an expense ratio of 0.17%.
Top ETFs and What They Track: Volatility ETFs
-
 Investing
5 Popular U.S. Equity ETFs for 2016 (SPY, AAPL)
Discover 5 ETFs that investors might use to obtain exposure to portions of the U.S. stock market. -
 Investing
Introduction to Exchange-Traded Funds
Here are the benefits of a mutual fund with the flexibility of a stock. -
 Tech
TechHow To Pick The Best ETF
Of the hundreds of exchange-traded funds on the market, some are bound to fail. Learn how to pick the best of the bunch. -
 Investing
Another Assets Record for US ETFs
ETFs listed in the U.S. continue to hit milestones in assets under management. -
 Investing
Another ETF Joins the $100B Club
IVV has joined the list of ETFs with $100 billion in assets. That makes two. -
 Investing
Little Guys Powering Big ETF Growth
Exchange traded funds continue growing at a torrid pace and retail investors are a big reason why. -
Investing
Modernize Your Portfolio With ETF Futures
Gain access to premier, highly liquid ETFs with lower capital requirements. -
 Investing
4 Trends in the ETF Market to Date in 2016 (SPY)
Learn about four emerging ETF trends in 2016, including what they signal about broader trends in investing and the financial services industry.