


By Ben McClure
The income statement is basically the first financial statement you will come across in an annual report or quarterly Securities And Exchange Commission (SEC) filing.
It also contains the numbers most often discussed when a company announces its results - numbers such as revenue, earnings and earnings per share. Basically, the income statement shows how much money the company generated (revenue), how much it spent (expenses) and the difference between the two (profit) over a certain time period.
When it comes to analyzing fundamentals, the income statement lets investors know how well the company's business is performing - or, basically, whether or not the company is making money. Generally speaking, companies ought to be able to bring in more money than they spend or they don't stay in business for long. Those companies with low expenses relative to revenue - or high profits relative to revenue - signal strong fundamentals to investors.
Revenue as an investor signal
Revenue, also commonly known as sales, is generally the most straightforward part of the income statement. Often, there is just a single number that represents all the money a company brought in during a specific time period, although big companies sometimes break down revenue by business segment or geography.
The best way for a company to improve profitability is by increasing sales revenue. For instance, Starbucks Coffee has aggressive long-term sales growth goals that include a distribution system of 20,000 stores worldwide. Consistent sales growth has been a strong driver of Starbucks' profitability.
The best revenue are those that continue year in and year out. Temporary increases, such as those that might result from a short-term promotion, are less valuable and should garner a lower price-to-earnings multiple for a company.
What are the Expenses?
There are many kinds of expenses, but the two most common are the cost of goods sold (COGS) and selling, general and administrative expenses (SG&A). Cost of goods sold is the expense most directly involved in creating revenue. It represents the costs of producing or purchasing the goods or services sold by the company. For example, if Wal-Mart pays a supplier $4 for a box of soap, which it sells to customers for $5. When it is sold, Wal-Mart's cost of good sold for the box of soap would be $4.
Next, costs involved in operating the business are SG&A. This category includes marketing, salaries, utility bills, technology expenses and other general costs associated with running a business. SG&A also includes depreciation and amortization. Companies must include the cost of replacing worn out assets. Remember, some corporate expenses, such as research and development (R&D) at technology companies, are crucial to future growth and should not be cut, even though doing so may make for a better-looking earnings report. Finally, there are financial costs, notably taxes and interest payments, which need to be considered.
Profits = Revenue - Expenses
Profit, most simply put, is equal to total revenue minus total expenses. However, there are several commonly used profit subcategories that tell investors how the company is performing. Gross profit is calculated as revenue minus cost of sales. Returning to Wal-Mart again, the gross profit from the sale of the soap would have been $1 ($5 sales price less $4 cost of goods sold = $1 gross profit).
Companies with high gross margins will have a lot of money left over to spend on other business operations, such as R&D or marketing. So be on the lookout for downward trends in the gross margin rate over time. This is a telltale sign of future problems facing the bottom line. When cost of goods sold rises rapidly, they are likely to lower gross profit margins - unless, of course, the company can pass these costs onto customers in the form of higher prices.
Operating profit is equal to revenues minus the cost of sales and SG&A. This number represents the profit a company made from its actual operations, and excludes certain expenses and revenues that may not be related to its central operations. High operating margins can mean the company has effective control of costs, or that sales are increasing faster than operating costs. Operating profit also gives investors an opportunity to do profit-margin comparisons between companies that do not issue a separate disclosure of their cost of goods sold figures (which are needed to do gross margin analysis). Operating profit measures how much cash the business throws off, and some consider it a more reliable measure of profitability since it is harder to manipulate with accounting tricks than net earnings.
Net income generally represents the company's profit after all expenses, including financial expenses, have been paid. This number is often called the "bottom line" and is generally the figure people refer to when they use the word "profit" or "earnings".
When a company has a high profit margin, it usually means that it also has one or more advantages over its competition. Companies with high net profit margins have a bigger cushion to protect themselves during the hard times. Companies with low profit margins can get wiped out in a downturn. And companies with profit margins reflecting a competitive advantage are able to improve their market share during the hard times - leaving them even better positioned when things improve again.
Conclusion
You can gain valuable insights about a company by examining its income statement. Increasing sales offers the first sign of strong fundamentals. Rising margins indicate increasing efficiency and profitability. It's also a good idea to determine whether the company is performing in line with industry peers and competitors. Look for significant changes in revenues, costs of goods sold and SG&A to get a sense of the company's profit fundamentals.
To learn more about reading financial statements, see Understanding The Income Statement or Advanced Financial Statement Analysis.
Fundamental Analysis: The Balance Sheet
Related Articles
-
 Investing
A Look At Corporate Profit Margins
Take a deeper look at a company's profitability with the help of profit margin ratios. -
 Investing
The Difference Between Gross and Net Profit Margin
To calculate gross profit margin, subtract the cost of goods sold from a company’s revenue; then divide by revenue. -
 Investing
Is Net Income The Same As Profit?
Net income and profit both deal with positive cash flow, but there are important differences between the two concepts. -
 Small Business
How Gross Margin Can Make or Break Your Startup
Find out how your startup's gross margin can impact your business, including why a mediocre margin may spell disaster for a budding business. -
 Investing
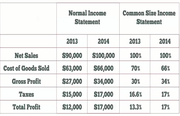
Explaining the Common Size Income Statement
A common size income statement expresses each account as a percentage of net sales. -
 Investing
12 things you need to know about financial statements
Before investing, discover 12 characteristics of financial statements that can help you evaluate companies and increase your chances of choosing a winner. -
 Investing
Operating Profit
Operating profit is the profit generated from the core business of a company before accounting for interest and taxes. -
 Investing
Look For These Red Flags In The Income Statement
Companies can overstate their revenues and understate their losses to boost investor confidence. Learn how to spot the these red flags in income statements.