


|

|
In the previous chapters, we’ve made a series of calculations relating to the economic profit calculation of Disney based on the 2015 annual report. Next, we’ll pull together these various components, plugging them into the formula in order to arrive at our final calculation.
The Formula
As a reminder, the basic formula for calculating economic profit is as follows:
Economic Profit = NOPAT – Capital Charge (Invested Capital X WACC)
Economic profit is the NOPAT figure less a capital charge. The capital charge can be thought of as a rental fee of sorts which is charged to the company for the use of capital. Put differently, economic profit represents the profits the company must generate in order for it to satisfy all lenders and shareholders who have “rented” out capital to the company. Economic profit is calculated as a metric based on a period of time, just like earnings or cash flow. In this example, we’re looking at Disney’s economic profit for the 2004 fiscal year.
Before we can plug our values into the formula, we’ll have to estimate the capital charge.
Capital Charge Equals Invested Capital Multiplied By WACC
We determined the invested capital calculation in the previous chapter. Next, we’ll have to estimate Disney’s WACC, or weighted average cost of capital. This figure is the average return expected by the total investor base. To determine WACC, we’ll need a cost of debt and a cost of equity.
Cost of Debt
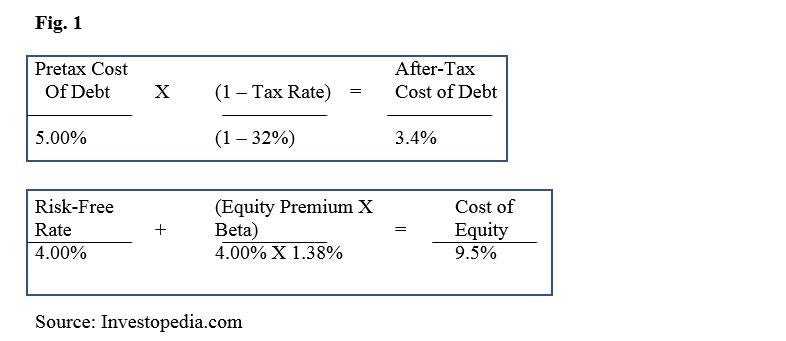
The cost of debt is a figure from the 10-K footnotes. In Disney’s case, we’ll have to make an estimate, because this company utilizes several different types of debt. This estimate can be completed by looking at the company’s long-term debt rating (at the time of this annual report, Disney’s Standard and Poor’s long-term debt rating was “A” indicating an upper medium grade debt). This corresponds to a debt cost of approximately 5%.
This 5% rate, however, represents a pretax cost of debt. When companies deduct interest expense from their tax bills, they earn a cash benefit. Thus, the after-tax cost of debt is lower. In order to determine this updated figure we multiply the pretax cost of debt by the tax shield; for Disney in 2015, the effective tax rate was 32%, and the tax shield was 68%. Thus, the after-tax cost of debt is 5% x 68%, or 3.4%.
Cost of Equity
While the cost of debt can be referenced in the 10K footnotes, the cost of equity is implicit. Shareholders expect returns on investment, but these returns are not uniform, nor are they set.
Because cost of equity has a theoretical basis, we can calculate it using one of several methods. We’ll use the capital asset pricing model (CAPM), a traditional method which is commonly used (but also commonly criticized). In CAPM, the expected return relates to the presumed risk of the stock as implied by the equity’s beta. Higher beta suggests greater risk and, therefore, an increased expected return.
According to the CAPM formula:
Cost of Equity = Risk-Free Rate + (Beta x Equity Premium)
Beta, a measure of risk, reflects a stock’s sensitivity to the overall market. If the beta value is 1.0, the stock will track the market closely. If the beta value is higher than 1.0, the stock will be more volatile than the market. For the end of FY2015, Disney’s beta was 1.38, suggesting a slightly higher risk level than the overall market.
The equity premium refers to the overall average excess return which investors expect above a risk-less investment, such as U.S. Treasury bonds. For our calculation, this figure is 4%. (For more on the calculation and debate, see the article series The Equity Risk Premium.) 4% for this figure is generally in the middle of the road.
According to the CAPM formula, we add 5.5% (the 4% equity premium multiplied by a beta value of 1.38) to a risk-less rate of 4%. Thus, our estimate for Disney’s cost of equity capital is 9.5%.
Figure 1 includes an illustration of the above calculations.
Weighted Average Cost of Capital
Next, we can calculate WACC. To accomplish this, multiply the cost of debt and equity by their respective proportions of invested capital, then add the two resulting numbers to one another.
We can find the proportion of debt and equity on Disney’s balance sheet. Adding up the debt yields a value of $23.71 billion. The market value of the equity is $178.9 billion. Debt thus represents 12% of invested capital, while equity is 88%. Ideally, we would want the market value of each; however, it’s easier to find the book value of debt, and because it usually tracks to the market value very closely, this is a good enough value for our calculations.
In Figure 2, we show the result of multiplying each category of cost of capital by its corresponding proportion of total capital. Next, we add these two weighted costs together, and we generate our WACC figure.
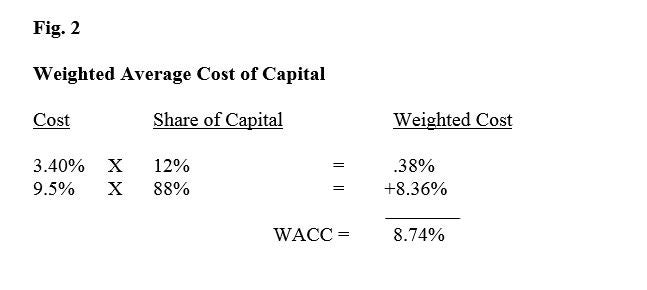
Source: Investopedia.com
Debt is cheaper than equity, as these calculations have revealed. The reasons for this are twofold: first, the pretax cost of debt represents a prior claim on the company’s assets, meaning that it is lower. Second, debt enjoys the tax shield (it is a tax-deductible charge), so a balance sheet without any debt is likely suboptimal. Companies can reduce their WACC by swapping out some equity for debt.
Why not swap out all equity for debt, then? The simple answer has to do with risk. A company has to service its debt, and the higher the share of debt, the greater the risk of default or bankruptcy. Figure 3 indicates estimates of WACC for Disney in the 2015 fiscal year based on a number of different debt-to-equity ratios. As you can see, the debt-to-equity ratio of 0.9 achieves a minimum WACC value. Theoretically, then, this represents Disney’s optimal capital structure, as it minimizes the cost of capital. Of course, this may not be including many other factors which we have left out of our calculations.
 Figure 3 Figure 3 |
Calculating Economic Profit
Now, we are finally ready to calculate economic profit itself, according to the formula found at the beginning of this tutorial chapter. Figure 4 illustrates how this calculation plays out:
Fig. 4 (numbers are in millions)

Summary
In this installment, we performed the final economic profit calculation, pulling together the components we explored and calculated throughout this tutorial. We started with NOPAT (calculated in chapter 3). Then we estimated invested capital (chapter 4). In this chapter we then estimated the capital charge by multiplying invested capital by the weighted average cost of capital. Finally, we subtracted the capital charge from NOPAT in order to get economic profit over the one-year period.
EVA: What Does It Really Mean?
-
 Small Business
Explaining Cost Of Capital
Cost of capital is the cost of funds used to finance a business. -
 Investing
How to calculate required rate of return
The required rate of return is used by investors and corporate-finance professionals to evaluate investments. In this article, we explore the various ways it can be calculated and put to use. -
 Personal Finance
What to know for an investment banking interview
Find out what you need to know and how to prepare for an investment banking interview. -
 Investing
Evaluating a Company's Capital Structure
Learn to use the composition of debt and equity to evaluate balance sheet strength.