


We find accounting profitability exclusively on the income statement, which teases out four levels of profit or profit margins: gross profit, operating profit, pre-tax profit and net profit.
Conceptually, the income statement assumes the following sequence: A company takes in sales revenue, then pays direct costs of the product of service. What’s left is gross margin. Then it pays indirect costs like company headquarters, advertising, and R&D. What’s left is operating margin. Then it pays interest on debt and adds or subtracts any unusual charges or inflows unrelated to the company’s main business with pre-tax margin left over. Then it pays taxes, leaving net margin, also known as net income, which is the very bottom line.
Three logistical points before getting to the math:
- Semantically, “profit,” “income,” and “margin,” are all used interchangeably, although margin usually refers to a percentage, whereas profit and income exclusively denote monetary amounts.
- When talking about profitability analysis, percentages are more frequently used than raw numbers because they enable comparison among companies and across a company’s own time horizon.
- Finding margin numbers is easy these days. You can never go wrong pulling the actual numbers from a company’s filings, but many of financial websites have them pre-calculated. Be careful though! Auto-calculating tools have been known to goof on rare occasion.
The major profit margins all compare some level of residual (leftover) profit to sales. For instance, a 42% gross margin means that for every $100 in revenue, the company pays $58 in costs directly connected to producing the product or service, leaving $42 as gross profit.
The Major Margins


Now we’ll see how WD-40 Co.’s (WDFC) 2016 margins look (data from page F-3 on the 2016 10-K):
- Gross profit margin: $214.4m / $380.7m = 56%
- Operating profit margin: $71.3m / $380.7m = 19%
- Pre-tax profit margin: $72.8m / $380.7m = 19%
- Net profit margin: $52.6m / $380.7m = 14%
How should we feel about these numbers? The quick answer is that these numbers show a strong business, at least by most standards.
For example, data from New York University finance professor Aswath Damodaran’s website indicates that as of January 2017, the average U.S. public company industry net profit margin was just 6%, with operating margin around 10%, well below WD-40’s. WD-40 (named for chemist Norm Larsen’s 40th attempt at a water displacement formula to coat intercontinental ballistic missiles) has a dominant market position with strong pricing power. Its products are cheap enough in the first place that consumers aren’t particularly motivated to save a few dimes on a generic substitute.
Peer comparisons are a bit tricky because WD-40 is really the only pure-play publicly traded lubricant company, which, in fairness, is a testament to the company’s dominance. Auto-populated investing websites will list industrial chemical companies like Dow and E.I. duPont as comparables or competitors; they’re much closer kin than, say, biotechs or railroads, but they’re not perfect yardsticks. And because WD-40 has held its competitive ground since it was founded in 1953 (long enough ago that if it were a person, WD-40 would already be collecting Social Security), we don’t have compelling evidence to believe that its margins will mean-revert to industrial chemical averages.
Margin of Error: Caveats About Using Income Statement Profit Margins
- Quoting profits in raw dollar (or other currency) terms and using percentage terms both come with problems. The raw currency number accurately depicts aggregate profit, but it is a clunky tool for comparison. Percentages accurately show per-unit profitability, but say nothing about units sold. Returning to professor Damodaran’s data for an example, U.S. grocery stores have a 1.89% average net margin, meaning they net just $1.89 for every $100 of merchandise sold. That sounds wimpy, but the end game is cash in the bank, and supermarkets can make up for their low margin with high volume.
- The income statement tells us very little about capital structure. A company could issue a slug of debt or sell a bunch of shares to get cash to boost sales and profits, but profits alone don’t reveal whether this was a value-adding move for shareholders.
- Income statement numbers are based on accrual accounting, and are thereby more subject to manipulation than cash flows.
- The income statement (at least under many countries’ accounting rules) doesn’t fairly capture the economics of all industries. For Real Estate Investment Trusts (REITs), for example, most analysts massage net income into a measure called funds from operations (FFO) that undoes an accrual called depreciation. Plug-and-chug types may miss these nuances if not careful.
The key limitation in divining profitability solely from the income statement is caveat (2) above: The income statement tells us only part of the profit picture – the inflows and immediate expenses used to generate those inflows – but not about the capital resources, like asset or equity base, required. For that, we’ll have to look at the balance sheet (and another lesson).
EBITDA: Earnings Before Bad Stuff?
One profitability number you won’t see on the income statement, but will see in a lot of other places (especially the haunts of investment bankers and Wall Street analysts) is earnings before interest, taxes, depreciation, and amortization, or EBITDA.
EBITDA, which would fit in between gross profit and operating profit were it to be on the income statement, is simply operating profit (or earnings before interest and taxes; i.e., EBIT) with the previously subtracted accrual charges of depreciation (the “D”) and amortization (the “A”) added back in.
What’s the point?
EBITDA came into vogue among 1980s investment bankers looking for a quick and dirty cash flow proxy (the Statement of Cash Flows wasn’t the norm until 1988). EBITDA caught a second wave in the tech-crazed 1990s, when earlier and earlier-stage companies saw IPO and acquisition interest.
Acquisition types like to express prices in terms of multiples of profit or cash flow: 20 times earnings, 12 times EBIT, etc.. But many hot companies of this generation didn’t have positive net income (so P/E multiples were out), and often had losses at the pre-tax and operating levels, too. Undeterred, bankers and sell-side Wall Street analysts went up and then off the income statement to produce a number more likely to be positive and easily comparable for early stage companies: EBITDA.
The value of EBITDA depends on its use. The metric leaves out a number of relevant expenses (“earnings before bad stuff” is one nickname), and the metric arguably sees too much use as a proxy for cash flow. Such cases suggest either poor understanding or even a shade of manipulativeness on behalf of the user.
Apparently, WD-40 didn’t get the memo about EBITDA’s warts: Page 21 of its 2016 proxy proclaims that EBITDA is both the #1 and #2 metric (per-segment, and consolidated, respectively) in determining management’s bonus. Fortunately, management appears to be well-behaved and effective, but an EBITDA target is considered risky because it leaves the door open for management to borrow vast sums of money to juice sales and EBITDA: The metric is blind to interest expense, debt outstanding, and capital expenditures.
Framing the Margins
Gross Profit Margin: Start with sales and take out costs directly related to creating or providing the product or service like raw materials, labor, and so on – typically bundled as "cost of goods sold,” “cost of products sold,” or “cost of sales” on the income statement – and you get gross margin. Done on a per-product basis, gross margin is most useful for a company analyzing its product suite (though this data isn’t shared with the public), but aggregate gross margin does show a company’s rawest profitability picture.
Companies have some discretion about whether to include certain expenses in cost of goods sold (COGS) or “selling, general and administrative” (SG&A) expenses, one expense line down the income statement. WD-40, for example, sticks some costs in SG&A that others stick in COGS. For analyzing or comparing WD-40’s operating margins, this is a non-event because the same costs are included; order doesn’t matter. But an investor making an investment decision solely based on gross margin analysis could mistakenly conclude that WD-40 is better than it really is. Fortunately, the situation is well-disclosed, at least to people who take the time to read the notes following financial statements (disclosures like these typically follow the actual financial statements on forms 10-K or 10-Q):
Note that our gross profit and gross margin may not be comparable to those of other consumer product companies, since some of these companies include all costs related to distribution of their products in cost of products sold, whereas we exclude the portion associated with amounts paid to third parties for shipment to our customers from our distribution centers and contract manufacturers and include these costs in selling, general and administrative expenses. These costs totaled $15.8 million and $16.2 million for the fiscal years ended August 31, 2015 and 2014, respectively.
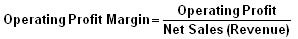
Operating Profit Margin: By subtracting selling, general and administrative, or operating expenses, from a company's gross profit number, we get operating income, also known as earnings before interest and taxes, or EBIT.
Operating profit is a big deal, sometimes more so than net income. All the costs of actually providing the product or service have been taken out, resulting in an income figure that’s available to pay both types of capital providers to the business (debt and equity holders), as well as the tax department. Operating profit is profit from a company’s main, ongoing operations; oddball accounting adjustments like income from discontinued operations and extraordinary items are accounted for below this line (they do get bundled into pre-tax income, discussed below). Accordingly, operating income feels purer and less prone to weird accounting-related fluctuations to analysts than net income. Finally, because operating income is conceptually “owned” by both debt and equity holders (whereas net income is just for equity holders, interest expense having been paid), it’s frequently used by bankers and analysts to value an entire company for potential buyouts.
Pretax Profit Margin: Take operating income and subtract interest expense while adding any interest income, adjust for non-recurring items like gains or losses from discontinued operations, and you’ve got pre-tax profit, or earnings before taxes, or EBT. Note that for whatever reason, pre-tax profit is relatively more popular among UK analysts, whereas operating income reigns supreme across the Atlantic.
Net Profit Margin: If someone asks you, “What’s your company’s profit margin?” they’re most likely asking about net profit margin, or a company’s bottom line after all other expenses, including taxes and one-off oddities, have been taken out of revenue. If you’re a stockholder net income is what you “own,” at least conceptually. If it feels like everybody and his brother gets paid before you do, it’s true. Unlike everybody else, who gets paid a set amount, you as a shareholder get whatever is left, be it much or little. Technically, you seldom actually get it: the company may choose to reinvest that profit, stockpile it, squander it, buy back shares, or pay shareholders a dividend (in which case you actually would get it, or at least some of it). But wherever it goes, net profit, as long as it’s not squandered, adds value to shareholders like us, which is why we bought the stock in the first place.
Profitability Indicator Ratios: Effective Tax Rate
-
 Investing
Gross, Operating and Net Profit Margins
A company’s income statement includes the company’s gross, operating and net profits. -
 Managing Wealth
What’s a Good Profit Margin for a New Business?
Surprisingly, the younger your company is, the better its numbers may look when it comes to your profit margin. -
 Investing
WD-40 Plunges on Soft Q1 Earnings
Shares of WD-40 (NASDAQ: WDFC) fell 9% in pre-market trading on Tuesday after the chemicals company posted weaker-than-expected first-quarter earnings. Revenue fell 4% year-over-year to $89.2 ... -
 Small Business
How Gross Margin Can Make or Break Your Startup
Find out how your startup's gross margin can impact your business, including why a mediocre margin may spell disaster for a budding business. -
 Investing
Find Investment Quality In The Income Statement
Use these key attributes to uncover top-level investments. -
 Investing
Industries that tend to have high EBITDA margins
Find out what industries typically have the highest EBITDA margins. Learn what factors influence how EBITDA margin differs from operating margin. -
 Investing
EBITDA: A clear look
EBITDA can be used to analyze and compare profitability between companies and industries, investors should understand that there are serious limits to it.