


A profit and loss diagram, or risk graph, is a visual representation of the possible profit and loss of an option strategy at a given point in time. Option traders use profit and loss diagrams to evaluate how a strategy may perform over a range of prices, thereby gaining an understanding of potential outcomes. Because of the visual nature of a diagram, traders can evaluate the potential profit and loss – and the risk and reward of the position – at a glance.
To create a profit and loss diagram, values are plotted along the X and Y axes. The horizontal axis (the x-axis) shows the underlying prices, labeled in order with lower prices on the left and higher prices towards the right. The current underlying price is usually centered along this axis. The vertical axis (the y-axis) represents the potential profit and loss values for the position. The breakeven point (that indicates no profit and no loss) is usually centered on the y-axis, with profits shown above this point (higher along the y-axis) and losses below this point (lower on the axis). Figure 8 shows the basic structure of a profit and loss diagram.
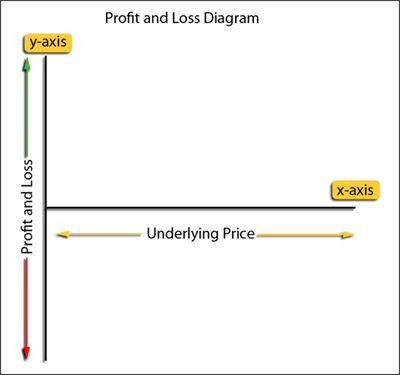 |
| Figure 8: The basic structure of a profit and loss diagram. Any value plotted above the x-axis would represent a gain; any value plotted below would indicate a loss. |
The blue line (below) represents the potential profit and loss across the range of underlying prices. For simplicity, we'll begin by taking a look at a long stock position of 100 shares. Assume an investor buys 100 shares of stock for $25 each, or a total cost of $2,500. The diagram in Figure 9 shows the potential profit and loss for this position. When the blue line is on $25 (the cost per share), note that the profit and loss value is $0.00 (breakeven). As the stock price moves higher, so does the profit; conversely, as the price moves lower, the losses increase. Since there is, in theory, no upper limit to the stock's price, the graph line shows an arrow on one end.
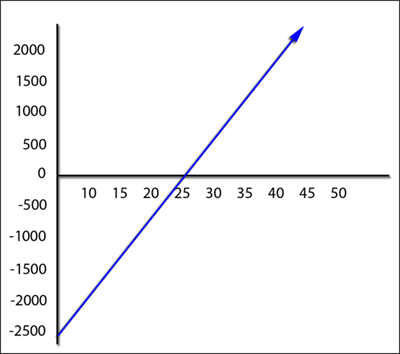 |
| Figure 9: A profit and loss diagram for a hypothetical stock (this does not factor in any commissions or brokerage fees). |
With options, the diagram looks a bit different since your downside risk is limited to the premium you paid for the option. In the example shown in Figure 10, a call option has a strike price of $50 and a $200 cost (for the contract). The downside risk is $200 – the premium paid. If the option expires worthless (for example, the stock price was $50 at expiration), the loss would be $200, as shown by the blue line intersecting the y-axis at a value of negative 200. The breakeven point would be a stock price of $52 at expiration. In this case, the investor would "lose" $200 by paying the premium, which would be offset by the stock's rising price (equal to a $200 gain).
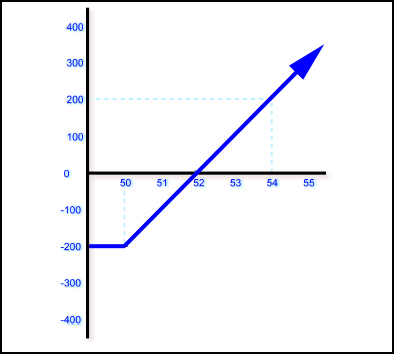 |
| Figure 10: A profit and loss diagram for a long option position. |
It should be noted that the above example shows a typical graph for a long call; each option strategy – such as long call butterflies and short straddles – has a "signature" profit and loss diagram that characterizes the profit and loss potential for that particular strategy. Figure 11, taken from the Options Industry Council's website, shows various options strategies and their corresponding profit and loss diagrams.
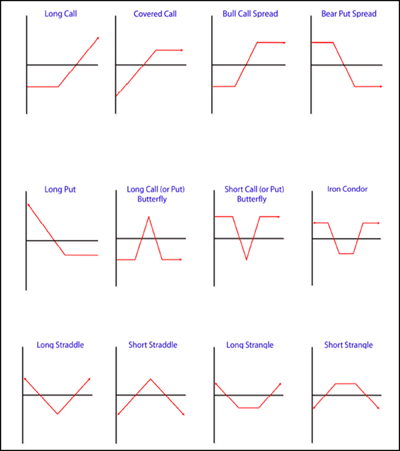 |
| Figure 11: Various profit and loss diagrams for different options strategies. Image is from the Options Industry Council website. |
Most options trading platforms and analysis software let you create profit and loss diagrams for specific options. In addition, the charts can be created by hand, by using spreadsheet software such as Microsoft Excel, or by purchasing commercially available analysis tools.
Options Pricing: The Greeks
-
 Trading
Options Hazards That Can Bruise Your Portfolio
Learn the top three risks and how they can affect you on either side of an options trade. -
 Trading
Getting acquainted with options trading
Learn about trading stock options, including some basic options trading terminology. -
 Investing
Risk Management Techniques For Shorting Call Options (IBM)
Shorting covered calls is a popular options trade strategy. Here are the methods to mitigate the risk/loss and enhance profits for selling covered calls -
 Trading
Option trading strategies: A guide for beginners
Options offer alternative strategies for investors to profit from trading underlying securities. Learn about the four basic option strategies for beginners. -
 Trading
The Basics of Options Profitability
Learn the various ways traders make money with options, and how it works. -
 Trading
Strip Options: A Market Neutral Bearish Strategy
Strip Options are market neutral trading strategies with profit potential on either side price movement, with a "bearish" skew. -
 Trading
Options -- Accessing Stakes In Apple At Less Cost
Finding Apple stock costly to trade? Here are multiple ways to trade it through low-cost Apple options. -
 Trading
Beginners Guide To Options Strategies
Find out four simple ways to profit from call and put options strategies. -
 Trading
Trade Covered Calls On High Dividend Paying Stocks
We explain the risks, rewards, timing, and profit and loss considerations for covered calls with dividend stocks. -
 Trading
Profit On Any Price Change With Long Straddles
In this strategy, traders cash in when the underlying security rises - and when it falls.