|

|
Bloomberg offers a robust suite of tools for analyzing, evaluating and trading stocks. In this chapter we will examine some of the tools Bloomberg offers fundamental and technical analysis , while in Part 3 we'll discuss techniques for monitoring markets, trading stocks and analyzing options. Note: navigating the Bloomberg terminal was covered in detail in the Beginners Guide to Bloomberg. As a reminder, most functions in Bloomberg have a shortcut abbreviation that can be typed into the system followed by the <ENTER> key in order to access that function. There are also menus for most types of securities which provide access to various functions.
Fundamental Analysis
For long-term investors, fundamental analysis is the cornerstone of any investment decision. Fortunately, the Bloomberg terminal provides access to an extensive library of fundamental data, as well as opinions and research from a wide variety of analysts and news sources. A good place to start is with the financial analysis homepage, accessed by typing <FA> <ENTER> into the Bloomberg terminal. This page offers a menu that provides financial statements (income statement, balance sheet, and cash flow statement) as well as a variety of reports that provide ratios and various valuation calculations.
Financial Analysis Homepage <FA>
 |
For users interested in more of a summary of financial information (as opposed to great detail) the description function on Bloomberg offers a great synopsis of financial information, in addition to a variety of other information.
Financial Information Within the Description Function for Microsoft Stock
 |
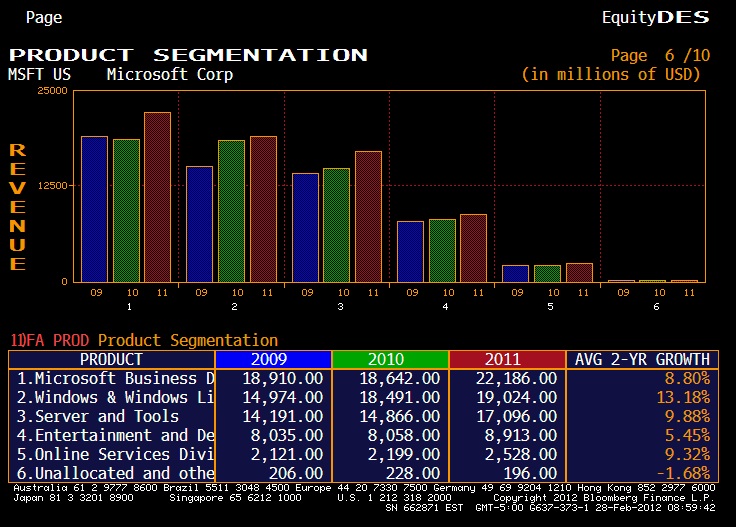
In addition to basic financial information, additional pages within the description functions break out a company's revenues by product segment (as displayed below) and geographic location. These functions can be helpful in determining where a company's sales are coming from and where future opportunities or risks might be found.
Revenue Breakdown Within the Description Function for Microsoft Stock
 |
Technical Analysis
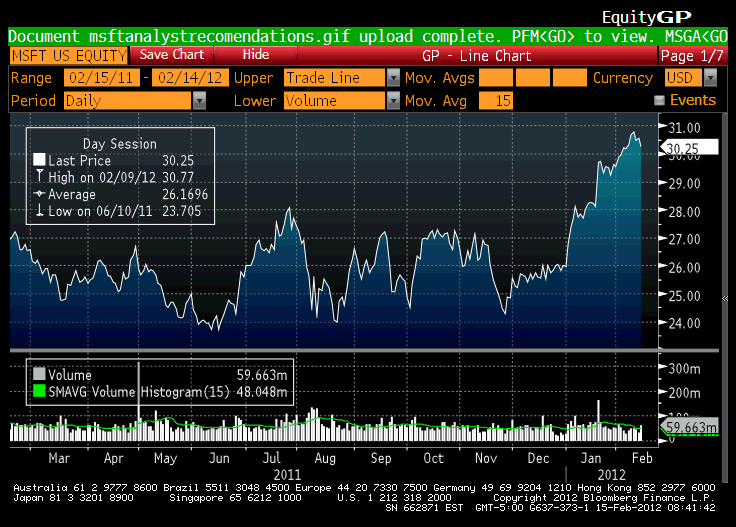
In addition to fundamental analysis, Bloomberg also provides a variety of tools for technical analysis. One starting place is a simple price graph, as detailed in the chart below. This chart, accessed by typing <GP> into the terminal, provides price movements in a line chart along with daily volume. You can control the timeframe over which the chart demonstrates movement, as well as the frequency of readings. For instance, for a very long-term view, a user might put in a 20-year date range, with monthly readings. For a more recent view, a user might look at three or six months of data on a daily basis. Note: if you prefer to see raw data rather than a chart, typing <HP> into the Bloomberg will give a listing of closing prices (as opposed to a line chart.)
Basic Price Chart <GP>
 |
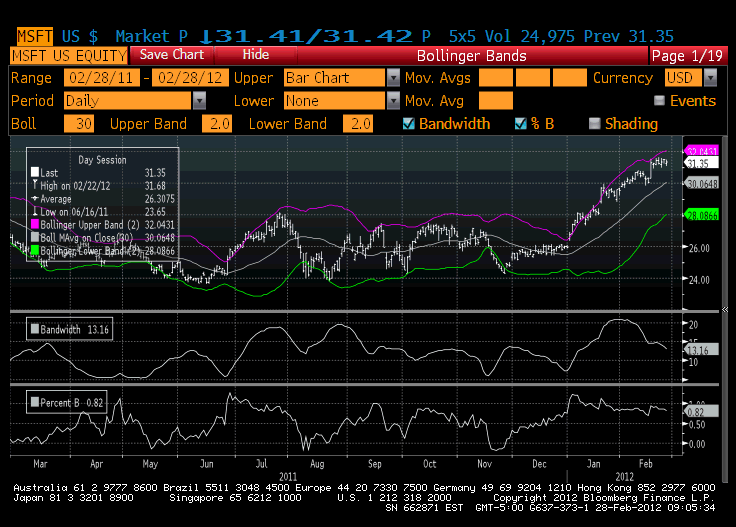
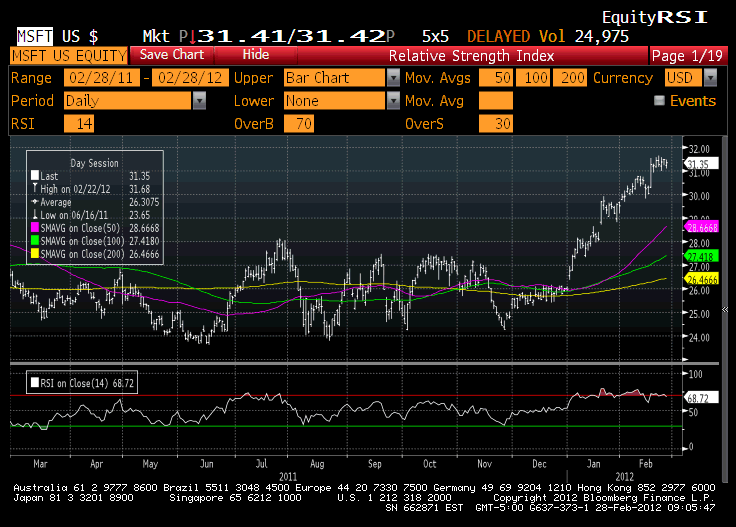
Bloomberg also provides more robust technical charting capabilities. For example, typing <RSI> into the terminal will provide a chart of relative strength, while typing <BOLL> into the terminal will provide a Bollinger Bands® chart. With either of these charts, there are numerous customizations available, including date range, frequency of measurement, moving averages, etc.
SEE: Using Bollinger Band® "Bands" To Gauge Trends
Bollinger Bands® Chart <BOLL>
 |
Relative Strength Chart <RSI>
 |
Advanced Guide To The Bloomberg Terminal: Equity Functions: Monitoring Markets, Trading And Options
-
 Tech
TechTop Bloomberg Tools For Financial Analysis
Market leader Bloomberg offers lots of tools; some are better for traders, some for financial analysts. Here are the top Bloomberg tools for the latter. -
 Personal Finance
The Bloomberg Terminal At A Glance
The Bloomberg Terminal is one of the most popular tools for real-time financial information. Find out what it is and what it can do for you. -
 Insights
How Bloomberg Makes Billions of Money Every Year
The privately-held company is believed to generate over $8 billion in annual revenue, take a look at how Bloomberg makes it's money in this article. -
 Investing
The Bloomberg Terminal: Step By Step
Bloomberg is synonymous with investment information- its media outlet and software/hardware are used by most, if not all, professional money managers.


