


One of the underlying tenets of technical analysis is that historical price action predicts future price action. Since the forex is a 24-hour market, there tends to be a large amount of data that can be used to gauge future price activity, thereby increasing the statistical significance of the forecast. This makes it the perfect market for traders that use technical tools, such as trends, charts and indicators. (To learn more, see Introduction to Technical Analysis and Charting Your Way To Better Returns.)
It is important to note that, in general, the interpretation of technical analysis remains the same regardless of the asset being monitored. There are literally hundreds of books dedicated to this field of study, but in this tutorial we will only touch on the basics of why technical analysis is such a popular tool in the forex market.
As the specific techniques of technical analysis are discussed in other tutorials, we will focus on the more forex-specific aspects of technical analysis.
Technical Analysis Discounts Everything; Especially in Forex
Minimal Rate Inconsistency
There are many large players in the forex market, such as hedge funds and large banks, that all have advanced computer systems to constantly monitor any inconsistencies between the different currency pairs. Given these programs, it is rare to see any major inconsistency last longer than a matter of seconds. Many traders turn to forex technical analysis because it presumes that all the factors that influence a price - economic, political, social and psychological - have already been factored into the current exchange rate by the market. With so many investors and so much money exchanging hands each day, the trend and flow of capital is what becomes important, rather than attempting to identify a mispriced rate.
Trend or Range
One of the greatest goals of technical traders in the FX market is to determine whether a given pair will trend in a certain direction, or if it will travel sideways and remain range-bound. The most common method to determine these characteristics is to draw trend lines that connect historical levels that have prevented a rate from heading higher or lower. These levels of support and resistance are used by technical traders to determine whether or not the given trend, or lack of trend, will continue.
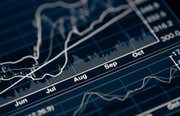
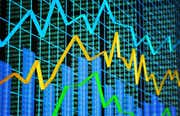
Generally, the major currency pairs - such as the EUR/USD, USD/JPY, USD/CHF and GBP/USD - have shown the greatest characteristics of trend, while the currency pairs that have historically shown a higher probability of becoming range-bound have been the currency crosses (pairs not involving the U.S. dollar). The two charts below show the strong trending nature of USD/JPY in contrast to the range-bound nature of EUR/CHF. It is important for every trader to be aware of the characteristics of trend and range, because they will not only affect what pairs are traded, but also what type of strategy should be used. (To learn more about this subject, see Trading Trend Or Range?)
 |
| Graph created by E-Signal. |
| Figure 1 |
 Graph created by E-Signal. Figure 2
Common Indicators
Technical traders use many different indicators in combination with support and resistance to aid them in predicting the future direction of exchange rates. Again, learning how to interpret various forex technical indicators is a study unto itself and goes beyond the scope of this forex tutorial. If you wish to learn more about this subject, we suggest you read our technical analysis tutorial.
A few indicators that we feel we should mention, due to their popularity, are: Bollinger Bands®, Fibonacci retracement, moving averages, moving average convergence divergence (MACD) and stochastics. These technical tools are rarely used by themselves to generate signals, but rather in conjunction with other indicators and chart patterns.
For more on technical analysis and the forex, take a look at the following articles: Using Bollinger Band® "Bands" To Gauge Trends, Trading Double Tops And Double Bottoms, Introducing The Bearish Diamond Formation, Keep An Eye On Momentum and Consolidation - Trade The Calm, Profit From The Storm.
Forex Tutorial: How To Trade & Open A Forex Account
-
 Trading
Intro to Types of Trading: Technical Traders
Explore in detail the technical trading approach, which looks to the past to predict the future. -
 Trading
Basics Of Technical Analysis
Learn how chartists analyze the price movements of the market. We'll introduce you to the most important concepts in this approach. -
 Trading
Technical Analysis Strategies for Beginners
Technical analysis helps traders and investors navigate the gap between intrinsic value and market price by leveraging certain techniques. -
 Trading
Getting started in forex
Before entering the foreign exchange (forex) market, you should define what you need from your broker and from your strategy. Learn how in this article. -
 Trading
Top 7 Books to Learn Technical Analysis
Here are five of the best books written on technical analysis to help traders and investors understand and apply technical analysis. -
Investing
Blending Technical and Fundamental Analysis
Find out how you can combine the best of both strategies to better understand the markets.