


|

|
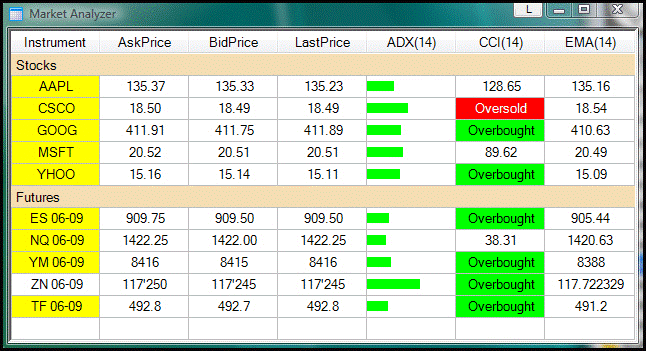
NinjaTrader's Market Analyzer window, shown in Figure 1, is a quote sheet that enables real-time market scanning of multiple instruments based on user-defined criteria. The Market Analyzer includes:
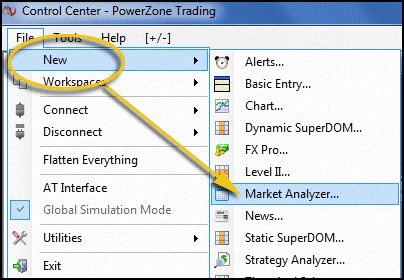
To open the Market Analyzer, from the Control Center click File > New > Market Analyzer, as shown in Figure 2. Any number of Market Analyzer windows can be opened simultaneously; however, more windows will require more PC resources.
Market Analyzer Display
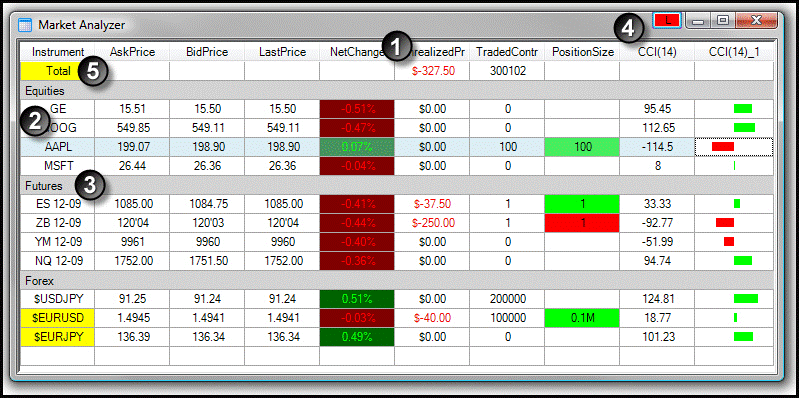
Each Market Analyzer window is free-floating and can be manually resized by dragging the edges of the window. The features of the Market Analyzer window, shown in Figure 3, include:
1. Columns - Displays the column name
2. Instrument Row - Displays the instrument name
3. Label Row - Displays a user-defined label row
4. Link Button - Links windows of the same instrument
5. Total Row - Displays the sum of all rows for a specific column
Adding Instruments
Note: NinjaTrader recommends adding instruments after defining the columns of the Market Analyzer window to minimize the reloading of historical data.
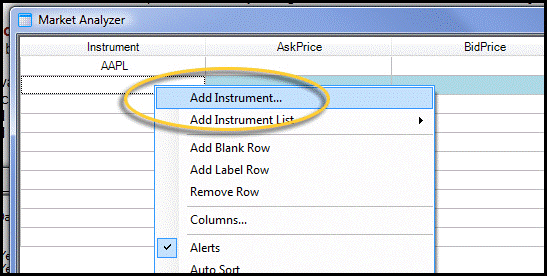
To add an instrument to the Market Analyzer (see Figure 4):
Label Rows
Label Rows allow traders to identify and separate groups of instruments in any way. For example, Labels can be used to identify Stocks, Futures.
SEE: Getting Started In Foreign Exchange Futures
To add a Label Row:
Right-click the Market Analyzer window and select "Add Label Row" from the menu, as shown in Figure 5.
Instruments that are dragged or added under a Label Row will automatically sort with the other instruments under that same Label Row.
Columns
Traders can add a variety of columns, ranging from indicators to position information, to the Market Analyzer. A list of Column headers is shown in Figure 6. The Columns window is used to add, remove and edit columns in the Market Analyzer window.
To open the Columns window, right-click in the Market Analyzer window and select "Columns" from the menu, as shown in Figure 7.
The Columns window is comprised of four sections (see Figure 8):
1. List of available columns
2. Current columns applied to the Market Analyzer
3. Selected column's parameters
4. Selected parameter's description
Adding Columns to the Market Analyzer Window
To add a column to the Market Analyzer window:
1. Highlight the desired column from the list of available columns.
2. Double-click or press the "New" button to add the column.
3. The column will now appear in the list of applied columns.
4. The column's parameters can be edited on the right side of the Columns window.
5. To change the order of the columns, use the up arrow to move columns to the left in the Market Analyzer window, and use the down arrow to move columns to the right.
6. Click "Apply" to apply the column(s) to the market Analyzer, and click "Close" to exit.
Removing Columns from the Market Analyzer Window
To remove a column from the Market Analyzer window:
1. In the Market Analyzer window, click and drag the column header to the outside of the Market Analyzer window; or
2. Open the Columns window, highlight the column to be removed and click "Remove."
Saving a Market Analyzer Template
Customized Market Analyzer layouts can be saved as a template that can be loaded in any open Market Analyzer window or set as the default layout. The column layout, column parameters and conditions, and Market Analyzer properties can all be saved in the template.
To save a Market Analyzer template:
1. Configure the Market Analyzer as desired.
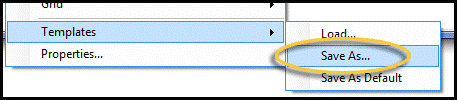
2. Right-click the Market Analyzer window and select "Templates" from the menu.
3. Select the sub-menu item "Save As …" or select "Save as Default" as shown in Figure 9.
4. Enter a name for the template and click "OK."
To load a saved Market Analyzer template:
1. Right-click in the Market Analyzer window and select "Templates" from the menu.
2. Select the sub-menu item "Load."
3. Select the desired template from the slide-out menu.
4. Click "OK."
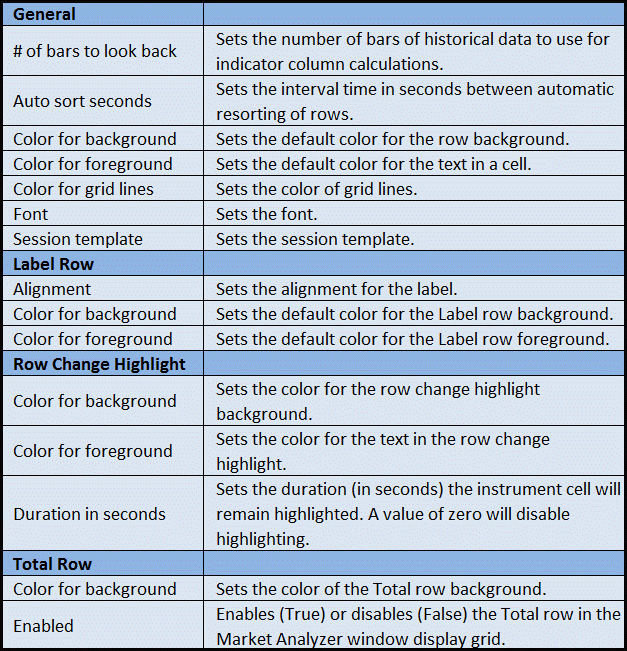
Market Analyzer Properties
Traders can customize the Market Analyzer window. To open the Market Analyzer Properties window, within the Market Analyzer window, right-click and select "Properties" from the menu.
Figure 10 shows a table with the properties that are available in the Market Analyzer Properties window, including brief descriptions of each.
SEE: Technical Top-Down Investing: Analyzing The Market
Creating an Alert Condition
Alert Conditions can be used to define a custom alert based on a cell's value. Alerts are defined per column in the Market Analyzer window, and relevant notifications are displayed in the Alert window. To enable or disable Alert Conditions, right-click in the Market Analyzer window; a check mark next to "Alerts" enables Alert Conditions; leave blank to disable.
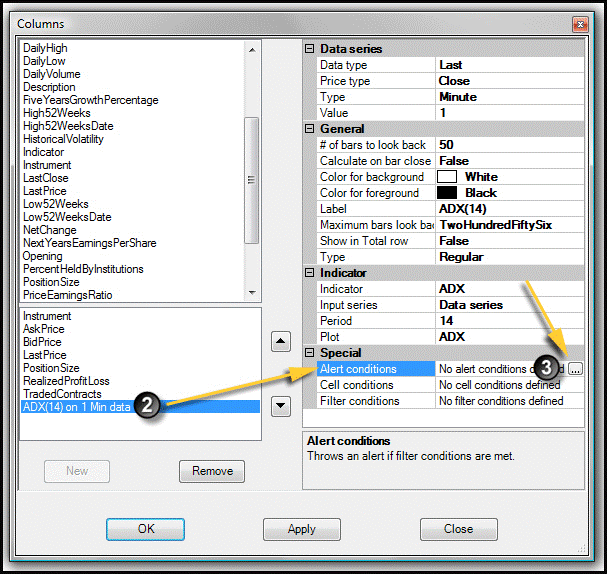
To create an Alert Condition (see Figure 11 and 12):
1. Open the Columns window (right-click and select "Columns").
2. Highlight the column in the applied column section for which the Alert Conditions will be created.
3. Under the Special parameters section, select "Alert Conditions" and then click the "…" button.
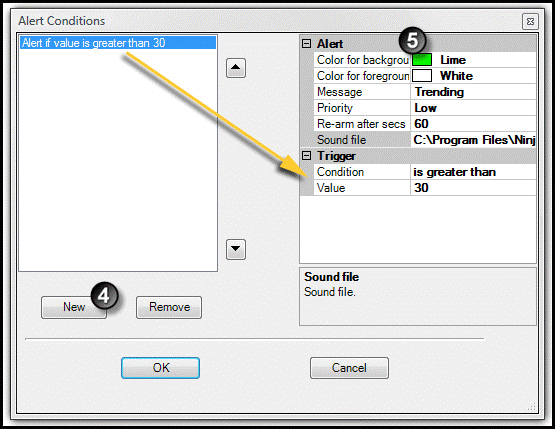
4. Click "New" to add a new Alert Condition to the list of that appears in the left side of the Alert Conditions window.
5. Set the Alert Condition properties in the right side of the Alert Conditions window.
The Alert Condition created in the above example will:
Creating Cell Conditions
Cell Conditions are used to define the display behavior of a cell based on the cell's value. Like Alert Conditions, Cell Conditions are defined per column. Both the color and text of a cell with Cell Conditions can be selected.
To create a Cell Conditions (see Figures 13 and 14):
1. Open the Columns window (right-click and select "Columns").
2. Select the column for which the Cell Condition will be created.
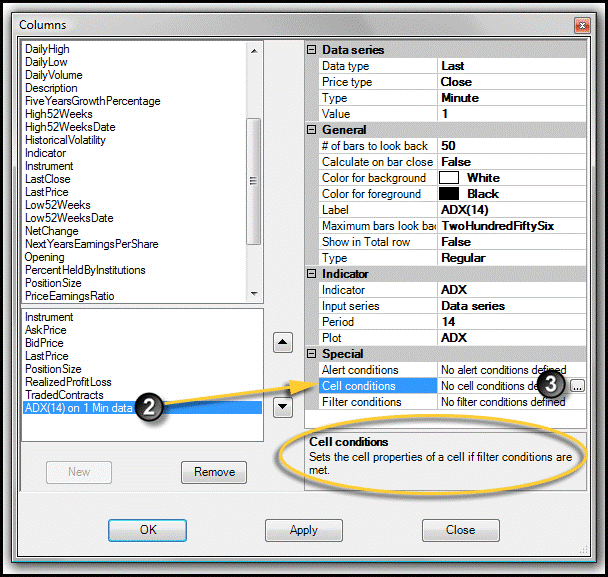
3. Under the Special parameters sections, select "Cell Conditions" and then click the "…" button.
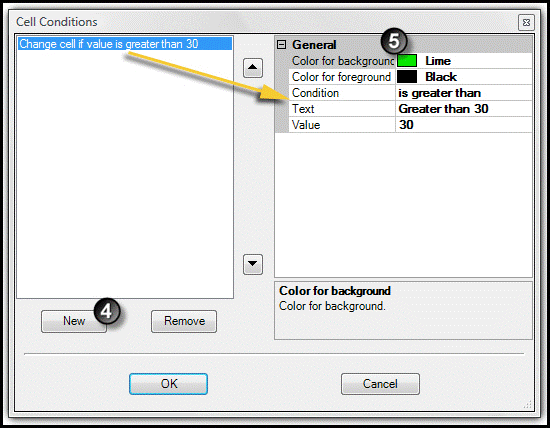
4. Click "New" to add a new Cell Condition to the list of Cell Conditions that appear in the left side of the Cell Conditions window.
5. Set the Cell Condition properties in the right side of the Cell Conditions window.
The Cell Condition illustrated in the above Figures will:
Filter Conditions are used to define conditions that filter out rows from the Market Analyzer grid display. Like Alert Conditions and Cell Conditions, Filter Conditions are based on the cell's value and are defined per column.
To create a Filter Condition (see Figures 15 and 16):
1. Open the Columns window (right-click and select "Columns").
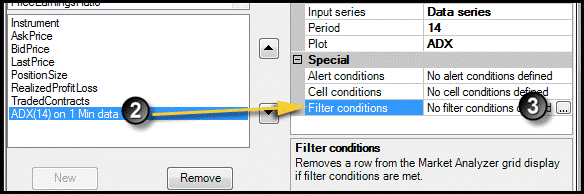
2. Select the column for which the Filter Condition will be created.
3. Under the Special Parameters section, select "Filter Conditions" and then click the "…" button.
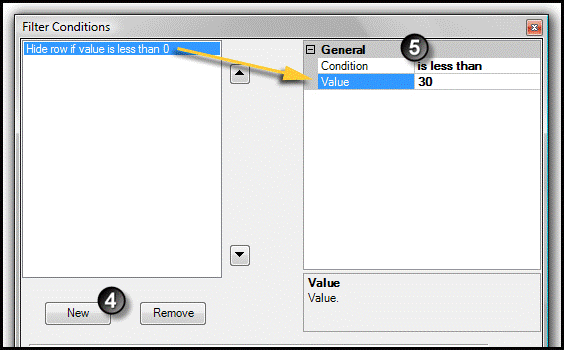
4. Click "New" to add a new Filter Condition to the list that appears on the left side of the Filter Conditions window.
5. Set the Filter Conditions properties in the right side of the window.
SEE: Master Futures Trading With Trend-Following Indicators
Advanced Guide To NinjaTrader: Strategy Analyzer
- 150-plus indicator columns
- Rules-based cell color coding and alerting
- Dynamic ranking, sorting and filtering
- Custom criteria through NinjaScript
 |
|
Figure 1: An example of NinjaTrader\'s Market Analyzer window. Image courtesy: NinjaTrader, LLC. |
To open the Market Analyzer, from the Control Center click File > New > Market Analyzer, as shown in Figure 2. Any number of Market Analyzer windows can be opened simultaneously; however, more windows will require more PC resources.
 |
|
Figure 2: To open the Market Analyzer, click File > New > Market Analyzer. |
Market Analyzer Display
Each Market Analyzer window is free-floating and can be manually resized by dragging the edges of the window. The features of the Market Analyzer window, shown in Figure 3, include:
1. Columns - Displays the column name
2. Instrument Row - Displays the instrument name
3. Label Row - Displays a user-defined label row
4. Link Button - Links windows of the same instrument
5. Total Row - Displays the sum of all rows for a specific column
 |
|
Figure 3: An overview of the Market Analyzer window. Image courtesy: NinjaTrader, LLC. |
Adding Instruments
Note: NinjaTrader recommends adding instruments after defining the columns of the Market Analyzer window to minimize the reloading of historical data.
To add an instrument to the Market Analyzer (see Figure 4):
- Double-click a row under the Instrument column to get a flashing text cursor, type in the desired symbol and press enter to add the instrument; or
- Right-click in the Market Analyzer window and select "Add Instrument" from the menu, enter a selection and click "OK."
 |
|
Figure 4: Double-click in a row under "Instrument" or right-click and select "Add Instrument" to add symbols to the Market Analyzer window. |
- Right-click in the Market Analyzer window and select "Add Instrument List" from the menu.
- Make a selection and click "OK."
Label Rows
Label Rows allow traders to identify and separate groups of instruments in any way. For example, Labels can be used to identify Stocks, Futures.
SEE: Getting Started In Foreign Exchange Futures
To add a Label Row:
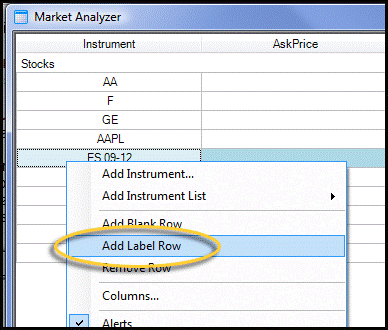
Right-click the Market Analyzer window and select "Add Label Row" from the menu, as shown in Figure 5.
 |
|
Figure 5: Right-click in the Market Analyzer and select "Add Label Row" to create user-defined labels. |
Instruments that are dragged or added under a Label Row will automatically sort with the other instruments under that same Label Row.
Columns
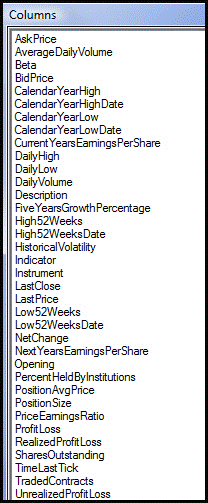
Traders can add a variety of columns, ranging from indicators to position information, to the Market Analyzer. A list of Column headers is shown in Figure 6. The Columns window is used to add, remove and edit columns in the Market Analyzer window.
 |
|
Figure 6: The list of available columns in the Columns window. |
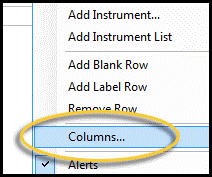
To open the Columns window, right-click in the Market Analyzer window and select "Columns" from the menu, as shown in Figure 7.
 |
|
Figure 7: Right-click in the Market Analyzer window and select "Columns" from the menu. |
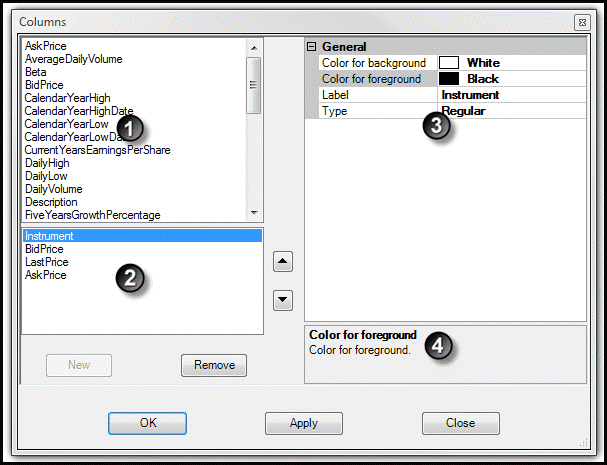
The Columns window is comprised of four sections (see Figure 8):
1. List of available columns
2. Current columns applied to the Market Analyzer
3. Selected column's parameters
4. Selected parameter's description
 |
|
Figure 8: The Columns window\'s four sections: 1) List of available columns; 2) Current columns; 3) Selected column\'s parameters; and 4) Selected parameter\'s description. Image courtesy: NinjaTrader, LLC. |
Adding Columns to the Market Analyzer Window
To add a column to the Market Analyzer window:
1. Highlight the desired column from the list of available columns.
2. Double-click or press the "New" button to add the column.
3. The column will now appear in the list of applied columns.
4. The column's parameters can be edited on the right side of the Columns window.
5. To change the order of the columns, use the up arrow to move columns to the left in the Market Analyzer window, and use the down arrow to move columns to the right.
6. Click "Apply" to apply the column(s) to the market Analyzer, and click "Close" to exit.
Removing Columns from the Market Analyzer Window
To remove a column from the Market Analyzer window:
1. In the Market Analyzer window, click and drag the column header to the outside of the Market Analyzer window; or
2. Open the Columns window, highlight the column to be removed and click "Remove."
Saving a Market Analyzer Template
Customized Market Analyzer layouts can be saved as a template that can be loaded in any open Market Analyzer window or set as the default layout. The column layout, column parameters and conditions, and Market Analyzer properties can all be saved in the template.
To save a Market Analyzer template:
1. Configure the Market Analyzer as desired.
2. Right-click the Market Analyzer window and select "Templates" from the menu.
3. Select the sub-menu item "Save As …" or select "Save as Default" as shown in Figure 9.
4. Enter a name for the template and click "OK."
 |
|
Figure 9: In the Market Analyzer window, right-click > Templates > Save As to save a Market Analyzer template. |
To load a saved Market Analyzer template:
1. Right-click in the Market Analyzer window and select "Templates" from the menu.
2. Select the sub-menu item "Load."
3. Select the desired template from the slide-out menu.
4. Click "OK."
Market Analyzer Properties
Traders can customize the Market Analyzer window. To open the Market Analyzer Properties window, within the Market Analyzer window, right-click and select "Properties" from the menu.
Figure 10 shows a table with the properties that are available in the Market Analyzer Properties window, including brief descriptions of each.
 |
|
Figure 10: A description of the available properties in the Market Analyzer Properties window. |
SEE: Technical Top-Down Investing: Analyzing The Market
Creating an Alert Condition
Alert Conditions can be used to define a custom alert based on a cell's value. Alerts are defined per column in the Market Analyzer window, and relevant notifications are displayed in the Alert window. To enable or disable Alert Conditions, right-click in the Market Analyzer window; a check mark next to "Alerts" enables Alert Conditions; leave blank to disable.
To create an Alert Condition (see Figure 11 and 12):
1. Open the Columns window (right-click and select "Columns").
2. Highlight the column in the applied column section for which the Alert Conditions will be created.
3. Under the Special parameters section, select "Alert Conditions" and then click the "…" button.
 |
|
Figure 11: Creating an Alert Condition in the Columns window. Image courtesy: NinjaTrader, LLC. |
4. Click "New" to add a new Alert Condition to the list of that appears in the left side of the Alert Conditions window.
5. Set the Alert Condition properties in the right side of the Alert Conditions window.
 |
|
Figure 12: Setting the properties for an Alert Condition. Image courtesy: NinjaTrader, LLC. |
The Alert Condition created in the above example will:
- Trigger and alert once the cell value is greater than 30 (for a 14-period ADX on 1-minute data),
- Display a lime green background with white text,
- Display "Trending" as the alert text,
- Re-arm the alert once 60 seconds have passed (note: setting the "Re-arm after secs" to a value of zero instructs the alert to not re-arm once it has been triggered),
- Display a "Low" priority and
- Play an alert sound.
Creating Cell Conditions
Cell Conditions are used to define the display behavior of a cell based on the cell's value. Like Alert Conditions, Cell Conditions are defined per column. Both the color and text of a cell with Cell Conditions can be selected.
To create a Cell Conditions (see Figures 13 and 14):
1. Open the Columns window (right-click and select "Columns").
2. Select the column for which the Cell Condition will be created.
3. Under the Special parameters sections, select "Cell Conditions" and then click the "…" button.
 |
|
Figure 13: Creating Cell Conditions in the Columns window. Image courtesy: NinjaTrader, LLC. |
4. Click "New" to add a new Cell Condition to the list of Cell Conditions that appear in the left side of the Cell Conditions window.
5. Set the Cell Condition properties in the right side of the Cell Conditions window.
 |
|
Figure 14: Setting the Cell Condition Properties in the right side of the Cell Conditions window. Image courtesy: NinjaTrader, LLC. |
The Cell Condition illustrated in the above Figures will:
- Trigger if the cell value is greater than 30.
- Display a lime green background with black text.
- Display "Greater than 30" as the text.
Filter Conditions are used to define conditions that filter out rows from the Market Analyzer grid display. Like Alert Conditions and Cell Conditions, Filter Conditions are based on the cell's value and are defined per column.
To create a Filter Condition (see Figures 15 and 16):
1. Open the Columns window (right-click and select "Columns").
2. Select the column for which the Filter Condition will be created.
3. Under the Special Parameters section, select "Filter Conditions" and then click the "…" button.
 |
|
Figure 15: Creating a Filter Condition in the Columns window. Image courtesy: NinjaTrader, LLC. |
4. Click "New" to add a new Filter Condition to the list that appears on the left side of the Filter Conditions window.
5. Set the Filter Conditions properties in the right side of the window.
 |
|
Figure 16: Setting the properties for the Filter Condition. Image courtesy: NinjaTrader, LLC. |
SEE: Master Futures Trading With Trend-Following Indicators
Advanced Guide To NinjaTrader: Strategy Analyzer
Related Articles
-
 Investing
Microsoft Windows 10 for Workstations Leaked
A new version of Windows 10 that appears targeted at high-power computers has accidentally leaked.