Usually, traders relate the strike price to the underlying price and to how much time remains on the option. These are typically considered the key fundamentals of pricing, although this approach can lead to unexpected and negative surprises. Many option buyers don’t anticipate that the expected move of the underlying is, in fact, already priced into the option’s value in some cases. Indeed, there are situations in which the underlying makes the anticipated move and then the option’s price actually declines, when the trader expected an increase. This mysterious feature of options pricing can sometimes be explained by implied volatility (IV). In this chapter, we’ll examine how IV impacts option prices and how IV differs from historical volatility.
Generally, options volatility is not very well understood when it comes to the movement of daily price changes of an option. However, volatility itself is a straightforward concept. When an option is quoted throughout the trading day, the bids and asks don’t actually tell much about the valuation of that option with regard to fundamentals. A fair market value from a pricing model is often out of line with the actual market value for that same option, and this is a phenomenon known as “option mispricing.” Deviations from the fundamentals may be due to expected or projected events, or by other elements not captured in pricing models. That difference is largely based on IV.
Why would we even want to use a model of option pricing if the option’s price actually deviates from the model’s price frequently? The answer is that sometimes these models can still be useful, and the reason is the amount of IV the market is pricing into the option itself. Option models typically calculate IV using both SV and current market prices. For example, if the price of a particular option should be three points in premium price and the option price today is at four, the additional premium would be attributed to IV pricing. To determine IV, analysts plug in current market prices of options (this is usually the average of the nearest just out-of-the-money option strike prices).
A Common IV Pitfall
Imagine that an option trader is bullish on a particular tech stock and is therefore interested in buying high beta stock call options. High beta stocks have the potential to make large moves, so the trader thinks that the potential for profit is higher when buying up call options. However, a crucial element to the equation is that options on these stocks (particularly when major news strikes) may experience price changes without movement of the underlying. Prices could move higher (even without a stock price move) simply because of an expected large move. This will occur on puts and calls; in this case, IV is going to be quite high. (To learn more, read Beta: Gauging Price Fluctuations.)
When the big news breaks and the stock moves higher, as the trader expected, the results can be disappointing with regard to the impact on the option price. The reason for this is that the reverse movement in IV takes place; IV falls after the news (it’s a bit like letting the air out of a balloon) and the IV (and, with it, some of the extrinsic value) deflates fast. With the drop in IV, the call buyer may be left frustrated by the fact that she didn’t make much, if anything, on the speculative purchase of calls. (For related reading, see Getting To Know The "Greeks" and Price Plunging? Buy A Put!)
For put buying, there may be surprises both positive and negative. The same process as outlined above operates also for buying puts, particularly if puts are purchased during bearish cycles for the stock in question. If the puts are purchased when they are “cheap” relative to IV levels (when a trader buys the puts when the trend has been upward and price action relatively uniform, and assuming no big pending news outcome), then IV may actually rise if the stock enters a bearish cycle. The result is often a positive surprise in the change of the option price, assuming that the trader bought the option when the IV was low near the market top. In this case, the price would increase more than that which is suggested by Delta.
Considering calls for a moment, when the calls are purchased when they are “cheap” relative to IV, the potential wheel spinning from IV dropping is diminished, but it’s not fully eliminated. The bottom line? Without an IV analysis and a close understanding of how IV relates to stock prices and options prices, a trader is likely to get burned at some point. If you’d like to avoid surprising losses, it’s helpful to spend the time to develop a basic understanding of IV.
How does IV get calculated?
IV can best be understood in relation to an option pricing model like the Black-Scholes model. There are five main variables or inputs (right-facing arrows, which are:
1. Stock price
2. Strike price
4. Days to expiration
5. Risk-free rate of interest
Using these inputs, the output is the fair value or theoretical price of the option. Of course, though, the fair value price is not always the price which the market has set for that same option. See Figure 1 for a visual representation of these inputs and output.
 |
| Copyright © 2007 Investopedia.com |
| Figure 1: Black-Scholes options pricing model inputs |
Option prices in the marketplace often deviate from theoretical prices. Figure 2 is a reverse flow model which presents the price output as an input, with volatility as an output. The model is solved for volatility in a case like this, where market price is used as the input; this is essentially how one calculates IV. Thus, if the market price is higher than it was the day before (with all other factors remaining the same), the explanation for that difference would be IV.
 |
| Copyright © 2007 Investopedia.com |
| Figure 2: Black-Scholes options pricing model reversed |
For the purposes of our tutorial, we’ll leave the exact derivation of IV to mathematicians. Generally speaking, though, if market price is above theoretical prices, this reflects the premium that market participants have placed on an option’s market price. They have expected greater volatility than SV is currently suggesting, so the implied volatility is signaling the best guess that the market has made for the future volatility of the underlying.
As a reminder, volatility in this case is typically unconnected to direction. Rising IV may often lift all boats, but IV skews can become even more extreme if they are regular features of a market. Skews are also known as IV “smiles” or “smirks,” and they are caused by price shifts in the marketplace which move away from theoretical prices. Thus, IV levels may vary for each strike along a strike price chain or between different expiration dates.
These concepts may be clearer when we view them in a real-world example. We’ll take some old data for cotton call options as an example. Today’s options software makes these processes easy, as it does most of the work to calculate IV and SV. For this example, we’ve used the scanning tool in OptionVue Analysis Software, setting search criteria for options that are showing both high historical volatility and high IV.
Commodity options tend to have very good volatility. In the data we’ve gathered here, we see the close of trading back on March 8, 2002; nonetheless, the principle applies to all options markets. When volatility is high, options buyers should be wary of straight options buying. In fact, they should probably look to sell. At times of low volatility, on the other hand, prices are usually better for buyers. Figure 3 contains the results of the scan in the software.
Options Scan for High Current Implied and Statistical Volatility
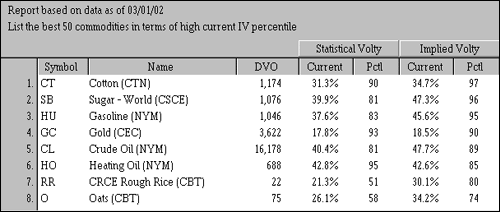 Figure 3 |
| Source: OptionVue |
According to our scan results, cotton tops the list. IV was 34.7% (the 97th percentile of IV, which is very high) based on the previous six years as a reference range. Additionally, SV was 31.3%, the 90th percentile of its six-year high-low range. These are overvalued options (because IV.SV) and they are high priced due to extreme levels of SV and IV together. Clearly, these are not options that any trader would wish to buy at this point, or at least not without being aware of their expensive nature.
Figure 4 shows how both IV and SV tend to revert to lower levels, and they can do so quite quickly. Thus, you can have a sudden collapse of IV and SV alike and a concordant quick fall in premiums, even if the price of cotton does not change. Option buyers can get fleeced in these situations if they aren’t careful.
Cotton Futures - Implied and Statistical Volatility
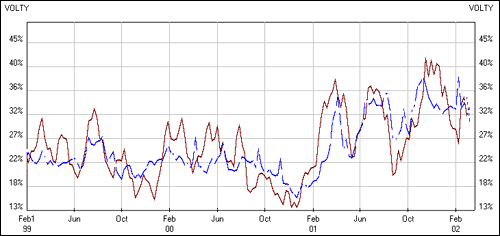 Figure 4: SV (blue) and IV (red) revert to normally lower levels |
| Source: OptionVue |
Lest you think that options in these situations are useless, there are excellent option writing strategies which can take advantage of high volatility. We’ll look at those techniques in future chapters. In the meantime, though, it’s a good idea to regularly check the levels of SV and IV before establishing any option position. In fact, it’s worthwhile to invest in high quality software in order to guarantee efficiency and accuracy in this process.
In Figure 4 above, cotton IV and SV came off of their extremes somewhat in the period following our initial inquiry, but they remain above the 22% levels (around which both IV and SV had oscillated for the previous years). What might have caused the overall increase in volatility? Figure 5 below contains a bar chart representing daily values for cotton futures, and this shows us something about those changing volatility levels.
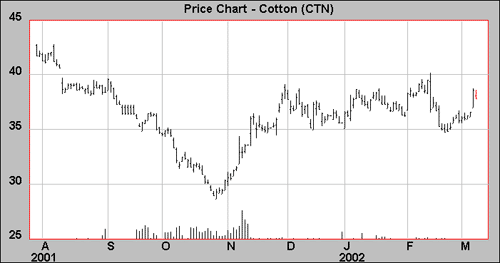 Figure 5 |
| Source: OptionVue |
As you can see, bearish declines took place in 2001 and there was a sudden v-shaped bottom in late October. These factors created a spike in volatility levels, which can be seen in the breakout higher volatility levels in the previous figure. As you’ll recall, the rate of change and the size of changes in price directly affect SV, and this can also increase IV as well, particularly because the demand for options relative to supply increases dramatically when traders expect a large move.
Finally, we’ll take a look at a particular facet of IV: volatility skew. Figure 6 below contains an options skew for cotton. The IV for calls increases as the option strikes get farther away from the money, forming a smile or smirk shape. This shows that the farther away from the money the call option strike is, the greater the IV is for that particular option strike (levels of volatility are represented along the vertical axis). Deep out-of-the-money calls are extremely inflated in terms of IV, with levels above 42%.
July Cotton Calls - Implied Volatility Skew
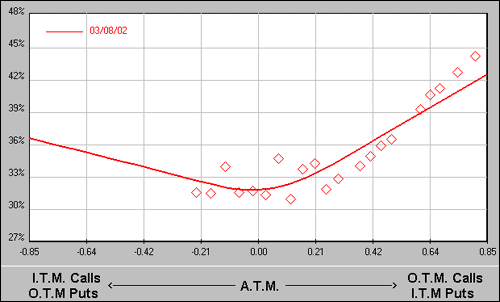 Figure 6 |
| Source: OptionVue |
The data for each of the call strikes from the chart above is displayed below in Figure 7. When we move away from the at-the-money call strikes, IV levels increase from 31.8% at the 38 strike to 42.3% for the July 60 strike (the latter is deep out of the money). In other words, those call strikes which are farther away from the money have more IV as compared with those nearer to the money. A trader can profit by selling the higher implied volatility options and buying lower implied volatility options, if the IV skew eventually levels out. Of course, this can happen even if there are no directional moves in the underlying futures.
July Cotton Calls - IV Skew
 |
| Figure 7 |
The Bottom Line
Volatility is the measure of how rapid price changes have been (SV) as well as what the market expects the price to do in the future (IV). By incorporating an awareness of these two types of volatility into trading, an options trader can gain a decisive edge.
IV is a measure of the market’s expected best guess of future volatility of the underlying. It can be calculated with the market price of an option as well as other inputs from price models, and then by solving for volatility (in effect, this is done by working backwards). Although this oversimplifies the math somewhat, the essential thing to keep in mind is that IV captures the degree of excess or deficit value on an option in terms of its theoretical price. Nearly all broker trading platforms provide an IV value for each strike (as well as an average IV for all of the options), so you don’t need to do the calculation directly yourself. What you should do, though, is an analysis of how high or low IV is compared with previous levels. No matter what, you’ll likely want to avoid the common mistake of buying at high IV and selling at low IV.
Options Volatility: Valuation
-
 Trading
Profiting From Position-Delta Neutral Trading
This trading strategy will show you how to gain from a decline in implied volatility. -
 Trading
Implied vs. Historical Volatility: The Main Differences
Discover the differences between historical and implied volatility, and how the two metrics can determine whether options sellers or buyers have the advantage. -
 Financial Advisor
6 Proven Tips For Series 6 Success
These techniques can help you pass the Series 6 exam without the added stress. Here are six tips to get you ready. -
 Trading
Beginners Guide To Options Strategies
Find out four simple ways to profit from call and put options strategies.


