


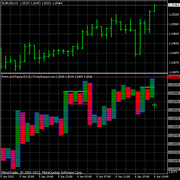
Any financial paper has stock quotes that will look something like the image below:
Columns 1 & 2: 52-Week High and Low - These are the highest and lowest prices at which a stock has traded over the previous 52 weeks (one year). This typically does not include the previous day's trading.
Column 3: Company Name & Type of Stock - This column lists the name of the company. If there are no special symbols or letters following the name, it is common stock. Different symbols imply different classes of shares. For example, "pf" means the shares are preferred stock.
Column 4: Ticker Symbol - This is the unique alphabetic name which identifies the stock. If you watch financial TV, you have seen the ticker tape move across the screen, quoting the latest prices alongside this symbol. If you are looking for stock quotes online, you always search for a company by the ticker symbol. If you don't know what a particular company's ticker is you can search for it on our markets page.
Column 5: Dividend Per Share - This indicates the annual dividend payment per share. If this space is blank, the company does not currently pay out dividends.
Column 6: Dividend Yield - The percentage return on the dividend. Calculated as annual dividends per share divided by price per share.
Column 7: Price/Earnings Ratio - This is calculated by dividing the current stock price by earnings per share from the last four quarters. For more detail on how to interpret this, see our P/E Ratio tutorial.
Column 8: Trading Volume - This figure shows the total number of shares traded for the day, listed in hundreds. To get the actual number traded, add "00" to the end of the number listed.
Column 9 & 10: Day High and Low - This indicates the price range at which the stock has traded at throughout the day. In other words, these are the maximum and the minimum prices that people have paid for the stock.
Column 11: Close - The close is the last trading price recorded when the market closed on the day. If the closing price is up or down more than 5% than the previous day's close, the entire listing for that stock is bold-faced. Keep in mind, you are not guaranteed to get this price if you buy the stock the next day because the price is constantly changing (even after the exchange is closed for the day). The close is merely an indicator of past performance and except in extreme circumstances serves as a ballpark of what you should expect to pay.
Column 12: Net Change - This is the dollar value change in the stock price from the previous day's closing price. When you hear about a stock being "up for the day," it means the net change was positive.
Quotes on the Internet
Nowadays, it's far more convenient for most to get stock quotes off the Internet. This method is superior because most sites update throughout the day and give you more information, news, charting, research, etc.
[Compare how different online brokerages display stock prices by visiting our Stock Broker Reviews.]
To get quotes, simply enter the ticker symbol into the quote box of any major financial site like Yahoo! Finance, CBS Marketwatch, or MSN Money. The example below shows a quote for Microsoft (MSFT) from Yahoo Finance. Interpreting the data is exactly the same as with the newspaper.
 |
Stocks Basics: Valuing Stocks
-
 Investing
How To Read A Stock Ticker
In order to properly read stock tickers, you must know how it is used for determining the market's trend. Learn how to read a stock ticker today. -
 Insights
How to Understand a Stock Quote
Trading stocks is a popular way to invest money. Learn the details of a quote and what its information suggests, including pricing data and charts. -
 Trading
Testing Point-and-Figure Patterns
Learn the patterns that will help you pinpoint and profit from breakouts. -
 Trading
Understanding The 2010 Options Symbology
There is a wealth of information in the expanded option symbols, but they should make things easier for traders. -
 Taxes
TaxesThe IRS Form 8949
Anytime you sell or exchange capital assets, you must report the transaction on your federal income tax return.