


|
Among the most popular technical indicators, moving averages are used to gauge the direction of the current trend. Every type of moving average (commonly written in this tutorial as MA) is a mathematical result that is calculated by averaging a number of past data points. Once determined, the resulting average is then plotted onto a chart in order to allow traders to look at smoothed data rather than focusing on the day-to-day price fluctuations that are inherent in all financial markets.
Simple moving average
The simplest form of a moving average, appropriately known as a simple moving average (SMA), is calculated by taking the arithmetic mean of a given set of values. In other words, a set of numbers, or prices in the case of financial instruments, are added together and then divided by the number of prices in the set. For example, to calculate a basic 10-day moving average you would add up the closing prices from the past 10 days and then divide the result by 10. In Figure 1, the sum of the prices for the past 10 days (110) is divided by the number of days (10) to arrive at the 10-day average. If a trader wishes to see a 50-day average instead, the same type of calculation would be made, but it would include the prices over the past 50 days. The resulting average below (11) takes into account the past 10 data points in order to give traders an idea of how an asset is priced relative to the past 10 days.
 |
| Figure 1 |
Perhaps you're wondering why technical traders call this tool a "moving" average and not just a regular mean or average? The answer is that as new values become available, the oldest data points must be dropped from the set and new data points must come in to replace them. Thus, the data set is constantly "moving" to account for new data as it becomes available. This method of calculation ensures that only the current information is being accounted for. In Figure 2, once the new value of 5 is added to the set, the red box (representing the past 10 data points) moves to the right and the last value of 15 is dropped from the calculation. Because the relatively small value of 5 replaces the high value of 15, you would expect to see the average of the data set decrease, which it does, in this case from 11 to 10. (For more, see:How is a simple moving average calculated?)
 |
| Figure 2 |
What Do Moving Averages Look Like On A Chart?
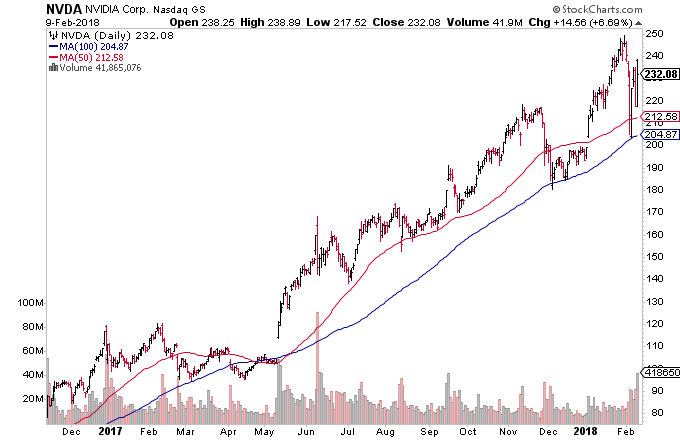
Once the values of the MA have been calculated, they are plotted onto a chart and then connected to create a moving average line. These curving lines are common on the charts of technical traders, but how they are used can vary drastically (more on this later). As you can see in Figure 3, it is possible to add more than one moving average to any chart by adjusting the number of time periods used in the calculation. These curving lines may seem distracting or confusing at first, but you'll grow accustomed to them as time goes on. The red line is simply the average price over the past 50 days, while the blue line is the average price over the past 100 days. (For more, see: Simple Moving Averages Make Trends Stand Out)
 |
| Figure 3 |
Now that you understand what a moving average is and what it looks like, we'll introduce a different type of moving average and examine how it differs from the previously mentioned simple moving average.
The simple moving average is extremely popular among traders, but like all technical indicators, it does have its critics. Many individuals argue that the usefulness of the SMA is limited because each point in the data series has the same weighting, regardless of where it occurs in the sequence. Critics argue that the most recent data is more significant than the older data and should have a greater influence on the final result. In response to this criticism, traders started giving higher importance to recent data, which has since led to the rise in popularity of weighted averages, the most popular of which is the exponential moving average (EMA). (For further reading, see Basics Of Weighted Moving Averages and What's the difference between an SMA and an EMA?)
Exponential Moving Average
The exponential moving average is a type of moving average that gives more weight to recent prices in an attempt to make it more responsive to new information. Learning the somewhat complicated equation for calculating an EMA may be unnecessary for many traders, since nearly all charting packages do the calculations for you. However, for you math geeks out there, here is the EMA equation:
 |
| Figure 4 |
When using the formula to calculate the first point of the EMA, you may notice that there is no value available to use as the previous EMA. This small problem can be solved by starting the calculation with a simple moving average and continuing on with the above formula from there.
The Difference Between the EMA and SMA
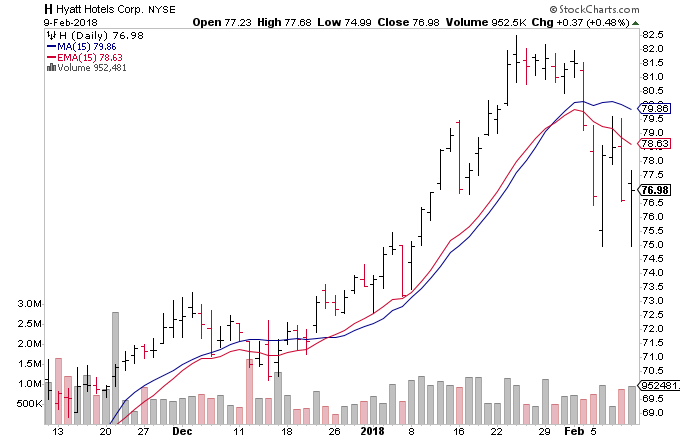
Now that you have a better understanding of how the SMA and the EMA are calculated, let's take a look at how these averages differ. By looking at the calculation of the EMA, you will notice that more emphasis is placed on the recent data points, making it a type of weighted average. In Figure 5, the numbers of time periods used in each average is identical (15), but the EMA responds more quickly to the changing prices. Notice how the EMA has a higher value when the price is rising, and falls faster than the SMA when the price is declining. This responsiveness is the main reason why many traders prefer to use the EMA over the SMA. (For further reading, see: Simple Vs. Exponential Moving Averages)
 |
| Figure 5 |
What Do the Different Days Mean?
Moving averages are a totally customizable indicator, which means that the user can freely choose whatever time frame they want when creating the average. The most common time periods used in moving averages are 15, 20, 30, 50, 100 and 200 days. The shorter the time span used to create the average, the more sensitive it will be to price changes. The longer the time span, the less sensitive, or more smoothed out, the average will be. There is no "right" time frame to use when setting up your moving averages. The best way to figure out which one works best for you is to experiment with a number of different time periods until you find one that fits your strategy. (For more, see: What are the most common periods used in creating moving average lines?)
Moving Averages: How To Use Them
-
 Trading
Simple Versus Exponential Moving Averages
These technical indicators help traders visualize trends by smoothing out price movements, but they are based on different calculations. -
 Trading
How to Use a Moving Average to Buy Stocks
The moving average (MA) is a simple technical analysis tool that smooths out price data by creating a constantly updated average price. -
 Trading
Do Adaptive Moving Averages Lead To Better Results?
These complex indicators can help traders interpret trend changes, but are they too good to be true? -
 Trading
The 7 Pitfalls of Moving Averages
While moving averages can be a valuable tool, they are not without risk. -
 Trading
Make This Indicator a Part Of Your Strategy
The relationship between price, 200-day EMA, and its slope of generate useful patterns that assist in price prediction and trade management. -
 Trading
Moving Averages
Discover one of the most reliable indicators in technical analysis and learn how to incorporate it into your trading routine. -
 Trading
Adjusting Strategies to Moving Average Slopes
Managing interrelationships between price, moving averages and slope can shift the reward:risk equation in your favor, learn more in this article.