


|
In the previous chapter, we estimated revenue growth for our five-year forecast period. Next, we’ll estimate the free cash flow generated over the forecast period.
Free Cash Flow
Free cash flow is a measure of a company’s financial performance. It represents how much cash a company has left from its operations – cash that could be used to pursue opportunities that improve shareholder value, including acquisitions, new product development, debt reduction and paying dividends to investors. We compute free cash flow by figuring out what’s left over from revenues after deducting operating costs, taxes, net investment and the working capital requirements.
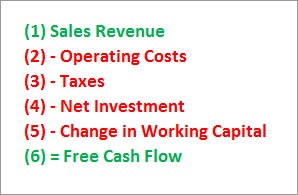 |
| The basic calculation for determining free cash flow. |
Before we can calculate free cash flow for ACME Corp., we have to figure out a few numbers first. After that, we’ll show an Excel spreadsheet populated with all the figures.
Future Operating Costs
All businesses incur operating costs, which include expenses such as cost of goods sold (CoGS); salaries; selling, general and administrative expenses (SGA); and research and development (R&D). If you can’t find a company’s operating costs on its income statement, you can calculate it by subtracting net operating profits (or earnings before interest and taxation – EBIT) from total revenues.
To forecast future operating costs, it can be helpful to look at a company’s historical operating margins, a figure expressed as a percentage, and calculated by taking operating income and dividing it by net sales or revenue. Likewise, operating cost margin can be calculated by dividing operating cost by net sales.
In our example, ACME Corp. has generated an average operating margin of 30% over the last three years, which means that for every $1 of revenue the company has generated, it’s incurred $0.70 in operating costs. Even though ACME would like to push cost margins down to 60% over the next five years, we’ll be conservative and assume that the company’s cost margin will be 65% over the first three years of the forecast period, followed by 70% in the last two years.
Taxation
Next, we need to look at ACME Corp.’s tax rate. Since many companies don’t actually pay the official corporate tax rate on their operating profits, you calculate the tax rate by taking the average annual income tax paid over the past few years, divided by pre-tax profits. You can find this information on the company’s historical income statements.
For our example, we’ll assume that ACME Corp. paid 30% income tax during each of the previous three years. With that in mind, we can project that the company will continue to pay the same rate over the next five years.
Net Investment
To support growth, companies need to keep investing in capital items – including property, plants and equipment. To calculate this net investment, we take capital expenditure (found in the company’s statement of cash flows) and subtract non-cash depreciation (found on the income statement).
We’ll assume for our example that ACME Corp. had $10 million in capital expenditures last year. Depreciation was $3 million, so they had a net investment of $7 million, or 7% of total revenues. During the prior two years, however, the company’s net investment was much higher, at 10% of revenues. Because ACME Corp. will likely need to boost capital investment to stay competitive, we’ll assume that net investment will steadily increase to 10% of revenues over the next five years, with 7.6% of sales in Year 1, 8.2% in Year 2, 8.8% in Year 3, 9.4% in Year 4 and 10% in Year 5.
Change in Working Capital
Working capital refers to the cash a company needs for day-to-day operations. The faster a company expands, the more cash it will need. To calculate working capital, we take current assets and subtract current liabilities. You can find both of these on a company’s balance sheet, which is published in its quarterly and annual financial statements.
In our example, ACME Corp.’s end-of-year balance sheet showed current assets of $25 million and current liabilities of $16 million, resulting in net working capital of $9 million. We need to find the change in working capital, which is the difference in working capital levels from one year to the next. If more cash is tied up in working capital than the previous year, the increase in working capital is treated as a cost against free cash flow.
In general, a company’s working capital needs will grow as revenues grow. In our example, we’ll assume that ACME Corp.’s working capital needs shadow its revenue growth: if revenues grow by 20% in the first year, working capital requirements will also grow by 20%, from $9 million to $10.8 million. We then track the change from year to year.
Putting it All Together
Now that we have all the different parts, we can calculate the free cash flow. For the sake of explanation, here’s a list of all the data on an Excel spreadsheet. Note that all numbers are in 1000s; for example, the Sales Revenue figure of $100,000 represents $100 million.
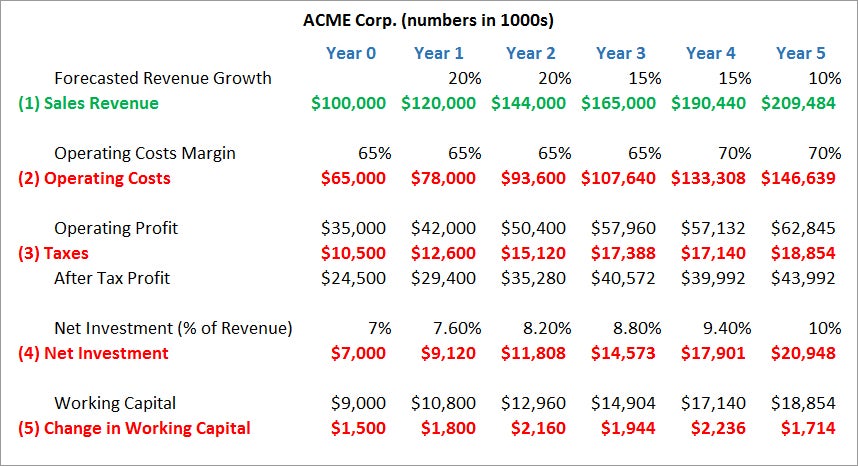 |
| An Excel spreadsheet with data from ACME Corp., used to calculated the company's free cash flow. |
Finally, we use a “streamlined” version of the spreadsheet to make the calculations and find ACME Corp.’s free cash flow. Again, all numbers are in 1000s.
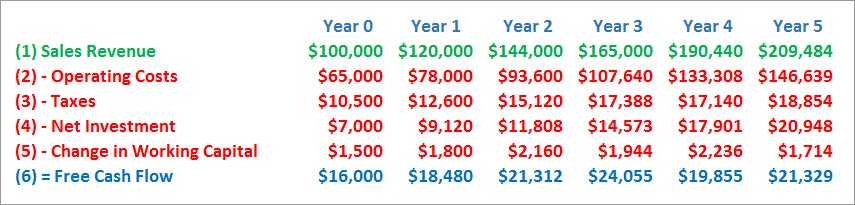 |
| ACME Corp.'s free cash flow. |
DCF Analysis: Calculating the Discount Rate
-
 Investing
Corporate Cash Flow: Understanding the Essentials
Tune out the accounting noise and see whether a company is generating the stuff it needs to sustain itself. Learn how to read the cash flow statement. -
 Investing
Cash Flow From Operating Activities
Cash flow from operating activities is a section of the Statement of Cash Flows that is included in a company’s financial statements after the balance sheet and income statements. -
 Investing
Introduction to Convertible Preferred Shares
These securities offer an answer for investors who want the profit potential of stocks but not the risk. -
 Investing
Free Cash Flow: Free, But Not Always Easy
Free cash flow is a great gauge of corporate health, but it's not immune to accounting trickery. -
 Investing
Analyzing the Price-to-Cash-Flow Ratio
Find out how analyzing the price-to-cash-flow ratio can help you make batter investment decisions. -
 Investing
Evaluate Stock Price With Reverse-Engineering DCF
This is a more accurate method to use when trying to find a target price for a stock. -
 Small Business
Understanding Cash Flow
Learn about the different types of cash flows and the importance for businesses to properly manage their cash flows.